Fig. 13
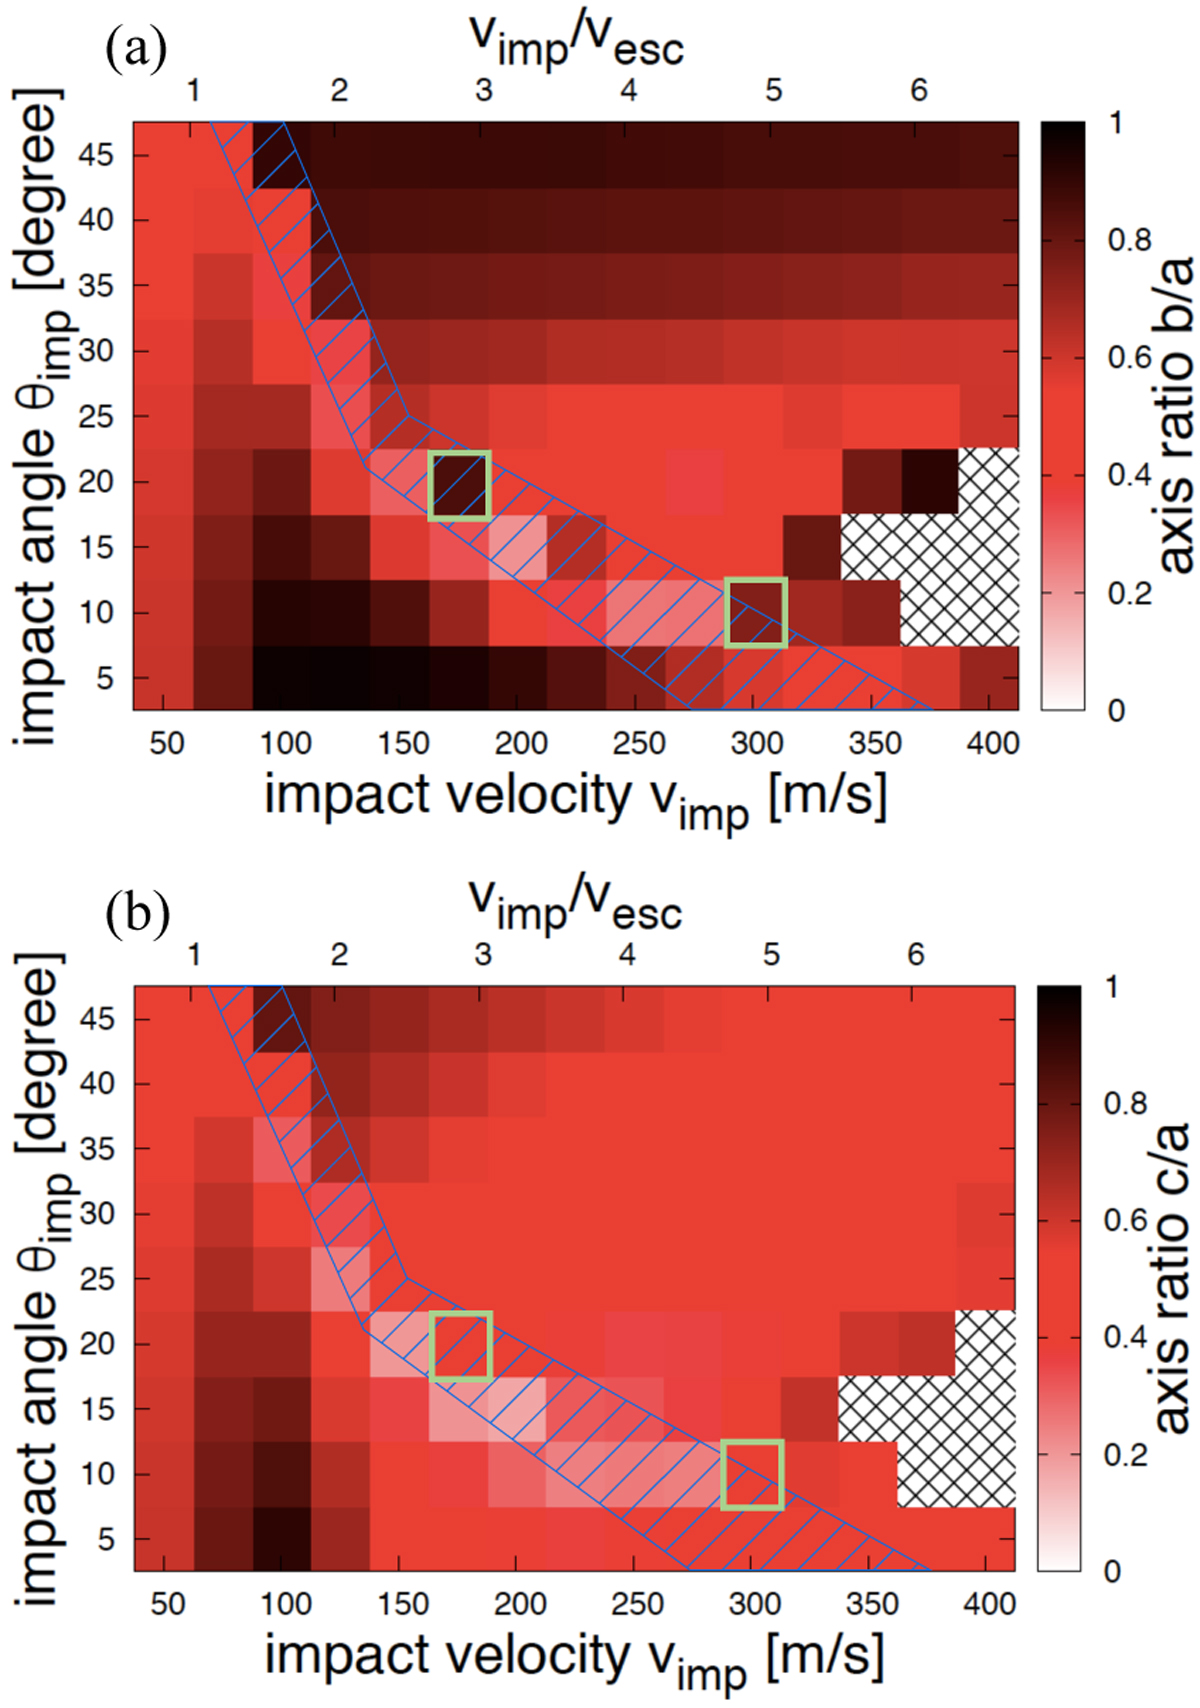
Dependence of the ratios b∕a and c∕a of the largestremnants on vimp and θimp. The ratios b∕a (panel a) and c∕a (panel b) are color-coded according to the scale on the right. For impacts in the cross-hatched region, we do not measure the axis ratios of the largest remnants because their mass is too small (less than 0.15 Mtarget). The meaning of the hatched regions is the same as in Fig. 5. Parameters surrounded by green boxes represent impacts with the second collision as shown in Appendix C.
Current usage metrics show cumulative count of Article Views (full-text article views including HTML views, PDF and ePub downloads, according to the available data) and Abstracts Views on Vision4Press platform.
Data correspond to usage on the plateform after 2015. The current usage metrics is available 48-96 hours after online publication and is updated daily on week days.
Initial download of the metrics may take a while.