Fig. 8.
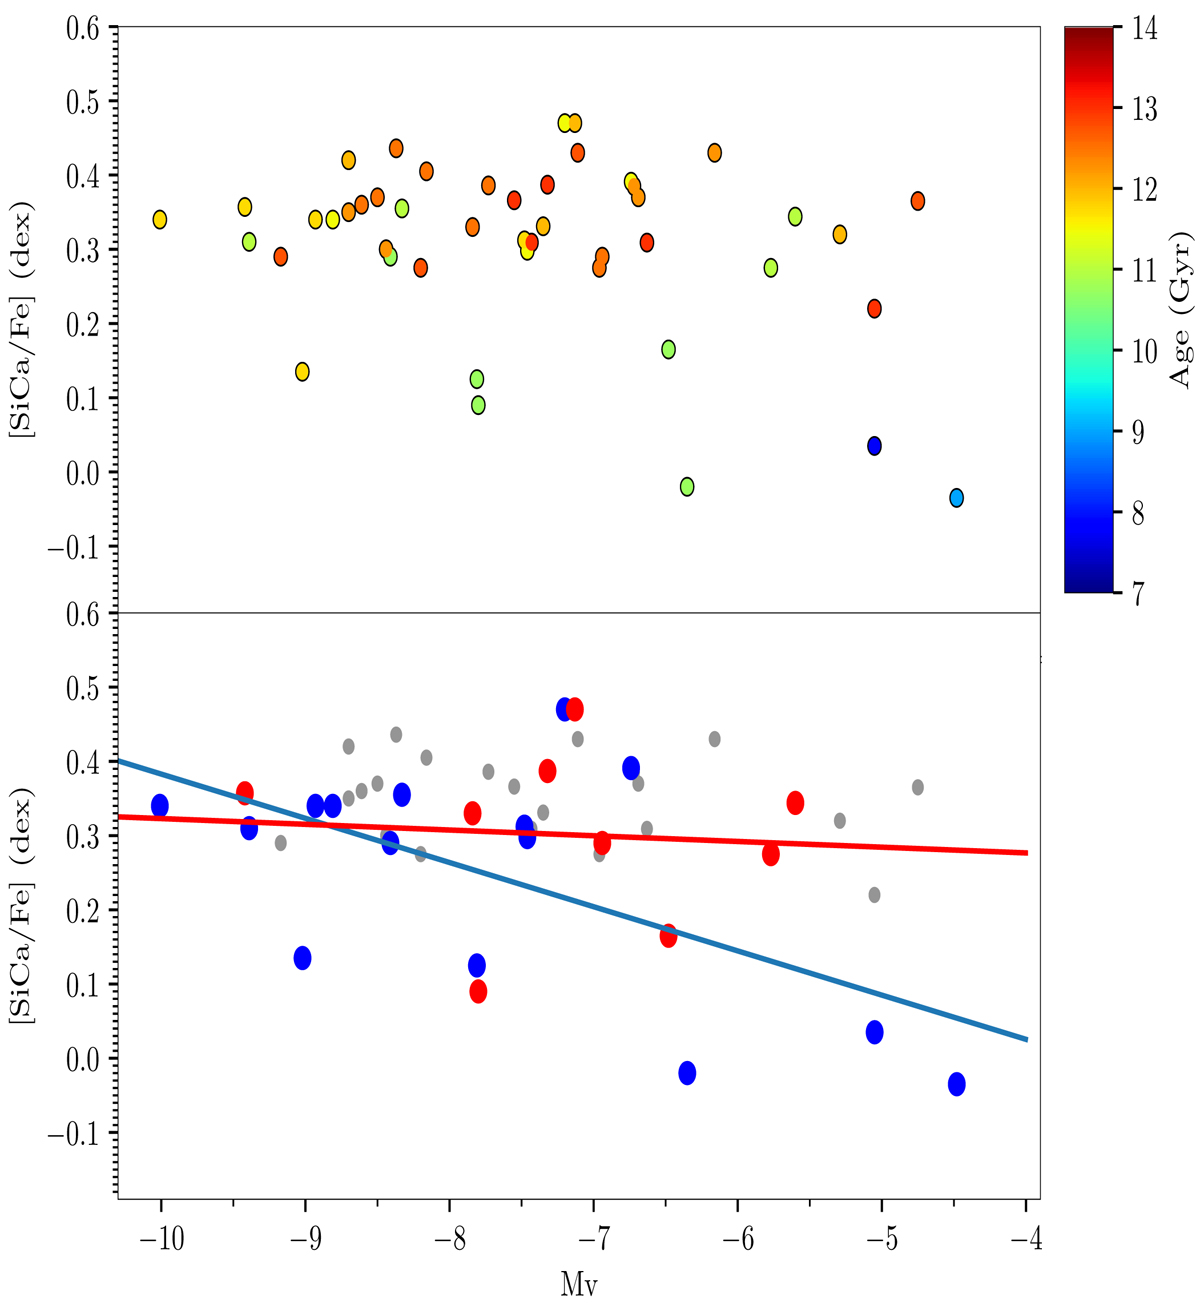
Top panel: [α/Fe] abundances as a function of total cluster magnitude for Si and Ca alone. Points are colour coded by age. Lower panel: same as the upper panel, but identifying clusters in the AMR metal-poor branch (blue points), the AMR metal-rich branch (red points), and the old metal-poor population (black points). The solid blue and red lines correspond to the linear fit of the metal-poor and the metal-rich branch clusters, respectively. An anti-correlation of the [SiCa/Fe] abundance with the total magnitude (r = −0.59) seems to be present only for metal-poor branch clusters.
Current usage metrics show cumulative count of Article Views (full-text article views including HTML views, PDF and ePub downloads, according to the available data) and Abstracts Views on Vision4Press platform.
Data correspond to usage on the plateform after 2015. The current usage metrics is available 48-96 hours after online publication and is updated daily on week days.
Initial download of the metrics may take a while.