Free Access
Fig. 7.
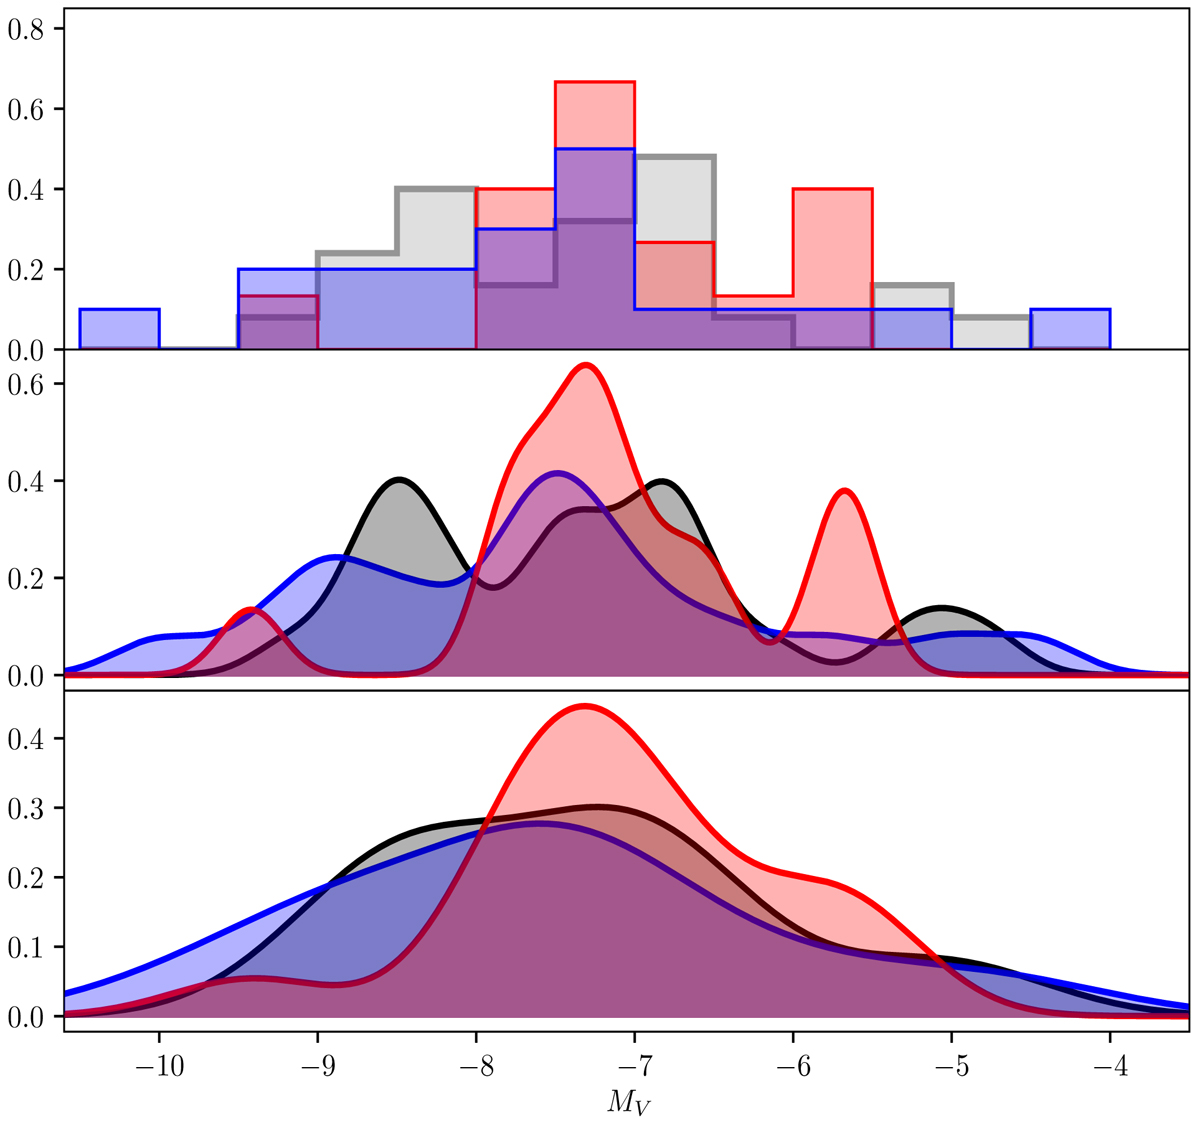
Top panel: normalised MV distribution of old in situ GCs (grey histogram) compared to that of the metal-poor branch clusters (blue histogram) and that of the metal-rich branch clusters (shown in red). Middle and lower panels: three distributions smoothed through a KDE, with a λ covariance factor of 0.2 and 0.5.
Current usage metrics show cumulative count of Article Views (full-text article views including HTML views, PDF and ePub downloads, according to the available data) and Abstracts Views on Vision4Press platform.
Data correspond to usage on the plateform after 2015. The current usage metrics is available 48-96 hours after online publication and is updated daily on week days.
Initial download of the metrics may take a while.