Fig. 4.
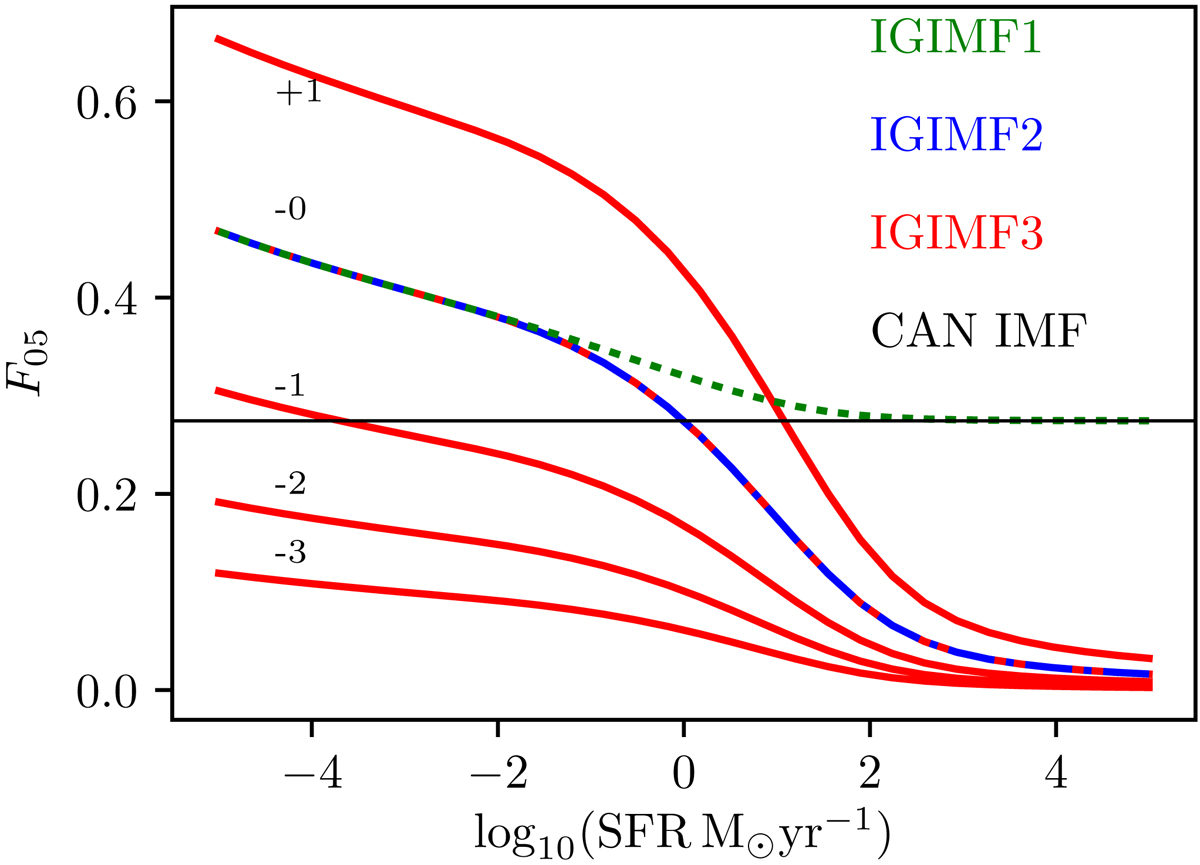
Mass fraction formed in δt = 10 Myr in stars less massive than 0.5 M⊙ relative to the total initial mass in the IGIMF models (Eq. (12)) is shown in dependence of the SFR and [Fe/H]. The canonical IMF is depicted as the horizontal black line (F05 ≈ 0.25). We note that the IGIMF1 and IGIMF2 models lead to F05 values as if the gwIMF were bottom heavy in comparison with the canonical IMF. However this is due to the normalization caused by the IGIMF being top light for low SFRs (<1 M⊙ yr−1).
Current usage metrics show cumulative count of Article Views (full-text article views including HTML views, PDF and ePub downloads, according to the available data) and Abstracts Views on Vision4Press platform.
Data correspond to usage on the plateform after 2015. The current usage metrics is available 48-96 hours after online publication and is updated daily on week days.
Initial download of the metrics may take a while.