Fig. 3.
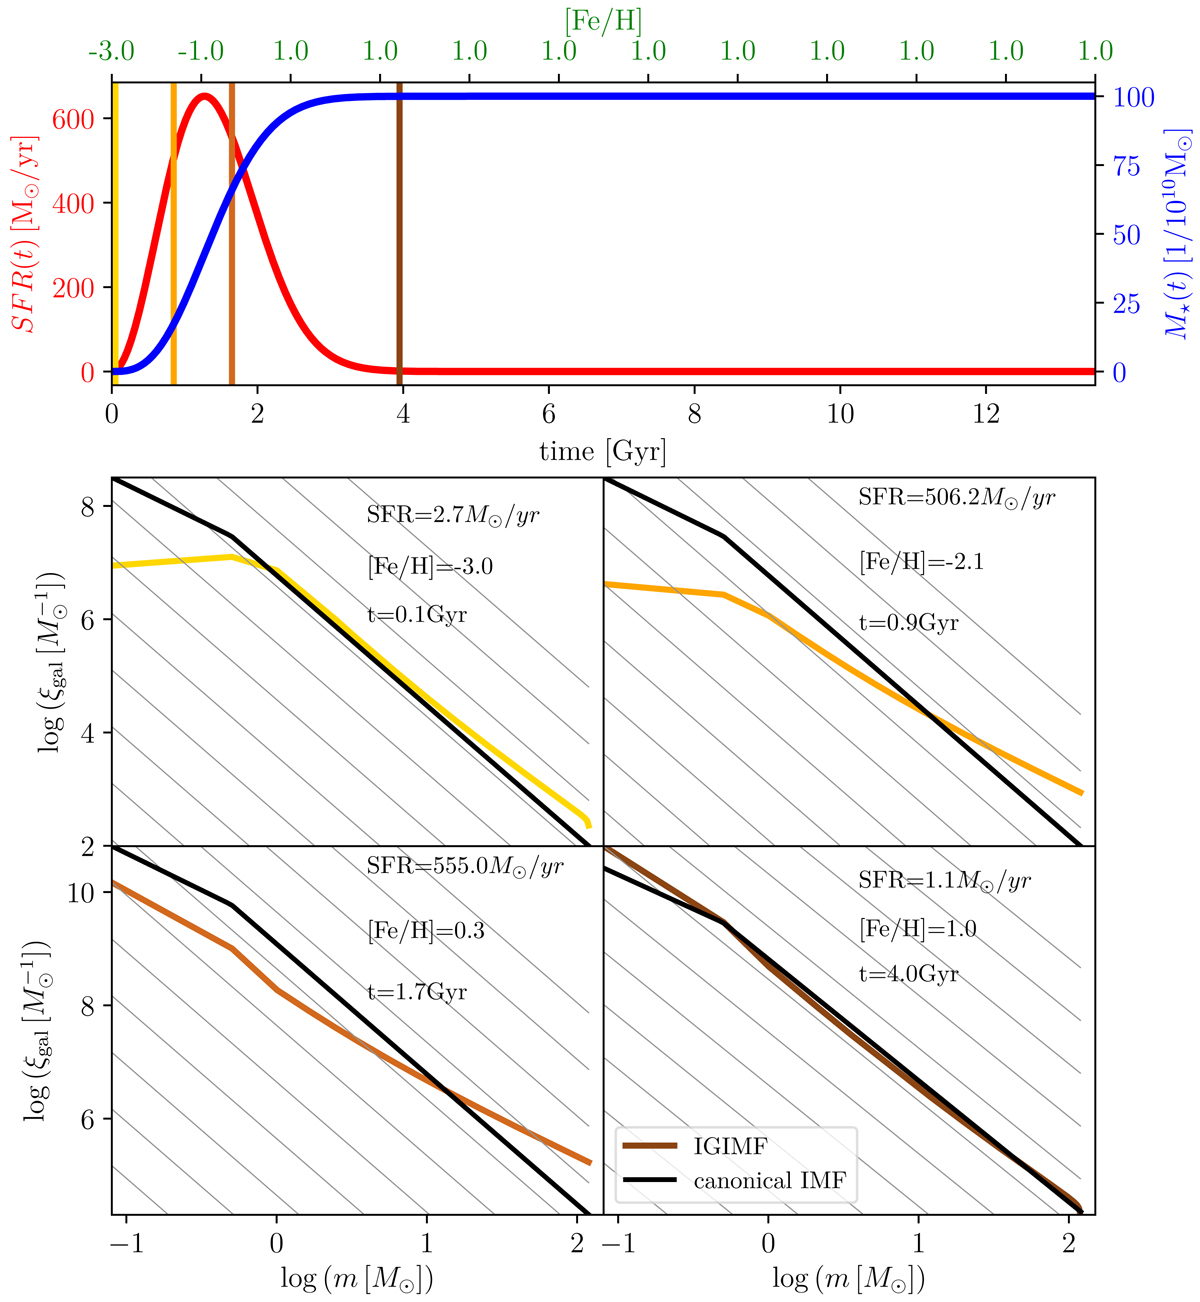
Example of IGIMF evolution with time, plotting only the IGIMF3 model. Top panel: prescribed evolution of the SFR with time (red solid curve, left y-axis), that is the SFH, stellar mass build-up with time (blue solid curve, right y-axis) , and the metallicity evolution (upper x-axis). This example serves to show a typical evolution and therefore the curves were synthetically created. This example of how a 1012 M⊙ elliptical galaxy assembles over about 1 Gyr is consistent with downsizing (Recchi et al. 2009), but due to stellar evolution the stellar mass of this galaxy is 2 × 10¹¹ M⊙ after 12 Gyr. Using the IGIMF grid, the same principle can be applied self-consistently in a chemo-dynamical code. In addition the four vertical lines represent the chosen time snapshots shown in the bottom panels. Bottom panels: four IGIMF plots at the chosen times (see top panel), showing how the IGIMF can potentially evolve throughout elliptical galaxy assembly. Shown is the top-heavy phase, but also the bottom-heavy phase during the metal-rich part of the evolution.
Current usage metrics show cumulative count of Article Views (full-text article views including HTML views, PDF and ePub downloads, according to the available data) and Abstracts Views on Vision4Press platform.
Data correspond to usage on the plateform after 2015. The current usage metrics is available 48-96 hours after online publication and is updated daily on week days.
Initial download of the metrics may take a while.