Fig. 2.
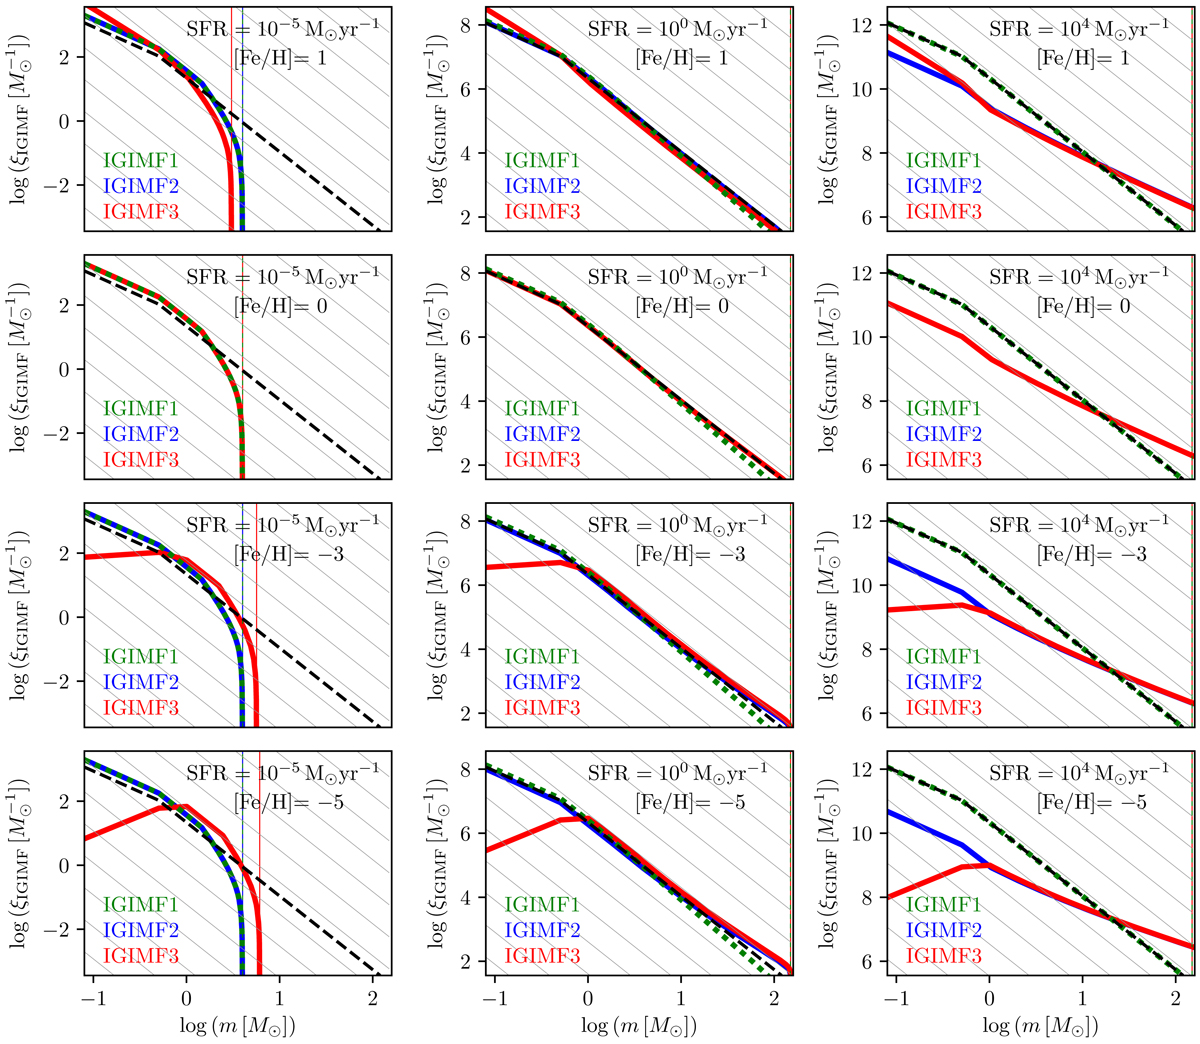
Selection of IGIMF models representing the overall characterization of the IGIMF grid published at the CDS with this work. The metallicity used in this figure is [Fe/H] = 1, 0, −3, −5 from top to bottom; the SFR = 10−5, 100, 104 M⊙ yr−1 from left to right. All IMF models are normalized to the total stellar mass formed over δt = 10 Myr to make the comparison with the canonical IMF (black dashed line in each panel) quantitative. To compare the slope variations we plot the Salpeter-Massey slope, α = 2.3, as a grey-line grid in each plot.
Current usage metrics show cumulative count of Article Views (full-text article views including HTML views, PDF and ePub downloads, according to the available data) and Abstracts Views on Vision4Press platform.
Data correspond to usage on the plateform after 2015. The current usage metrics is available 48-96 hours after online publication and is updated daily on week days.
Initial download of the metrics may take a while.