Fig. 9
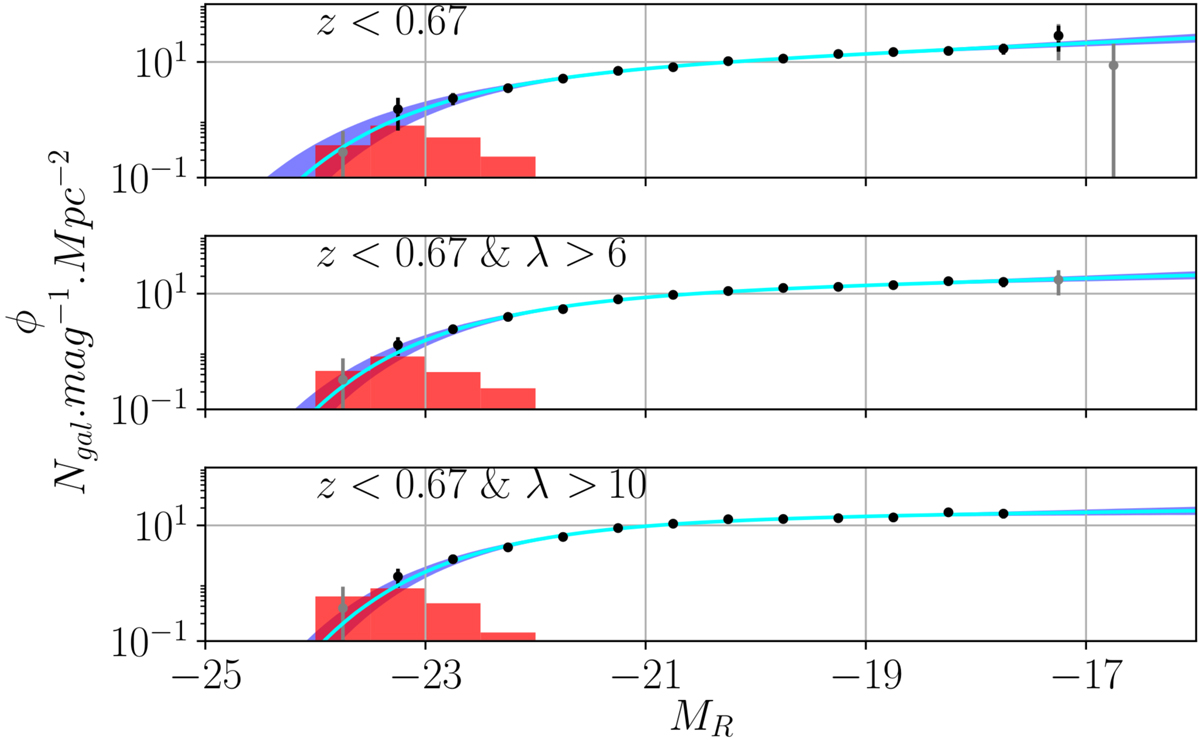
Composite luminosity functions including all clusters with a redshift lower than 0.67 (top panel), plus a richness higher than 6 (middle panel) or 10 (bottom panel). The black points represent the counts, whereas the blue regions show the 68% c.i. around the median parametrised composite luminosity functions (cyan lines). The red normalised histograms show the magnitude distributions of the BCGs of all clusters included in each bin. The grey points show the counts when there are fewer than 4.5 clusters contributing, and are not taken into account in the fitting procedure.
Current usage metrics show cumulative count of Article Views (full-text article views including HTML views, PDF and ePub downloads, according to the available data) and Abstracts Views on Vision4Press platform.
Data correspond to usage on the plateform after 2015. The current usage metrics is available 48-96 hours after online publication and is updated daily on week days.
Initial download of the metrics may take a while.