Fig. 8
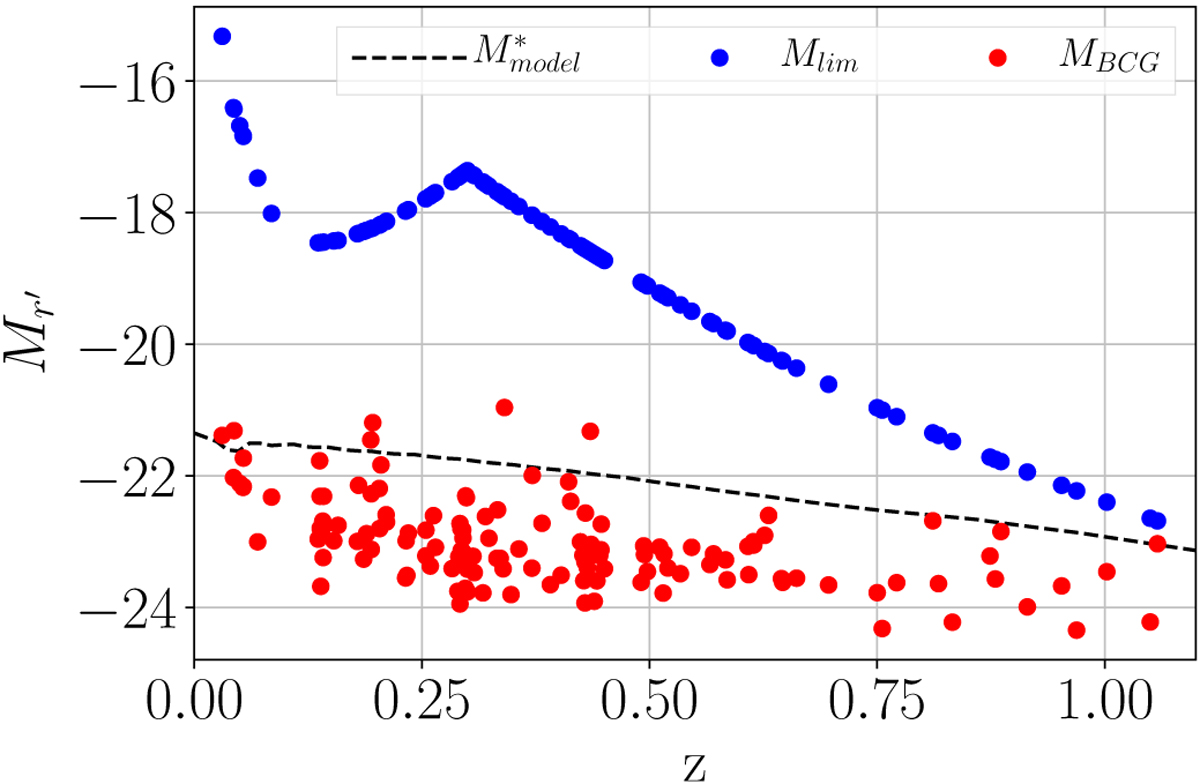
Redshift evolution of the luminosity range in which the LF are fitted. The red dots show theabsolute magnitude of the BCGs of each cluster, whereas the blue ones indicate the limiting magnitude we imposed. A fiducial model (see end of Introduction) for the evolution of M* is indicated by the black dashed line for comparison.
Current usage metrics show cumulative count of Article Views (full-text article views including HTML views, PDF and ePub downloads, according to the available data) and Abstracts Views on Vision4Press platform.
Data correspond to usage on the plateform after 2015. The current usage metrics is available 48-96 hours after online publication and is updated daily on week days.
Initial download of the metrics may take a while.