Fig. 6
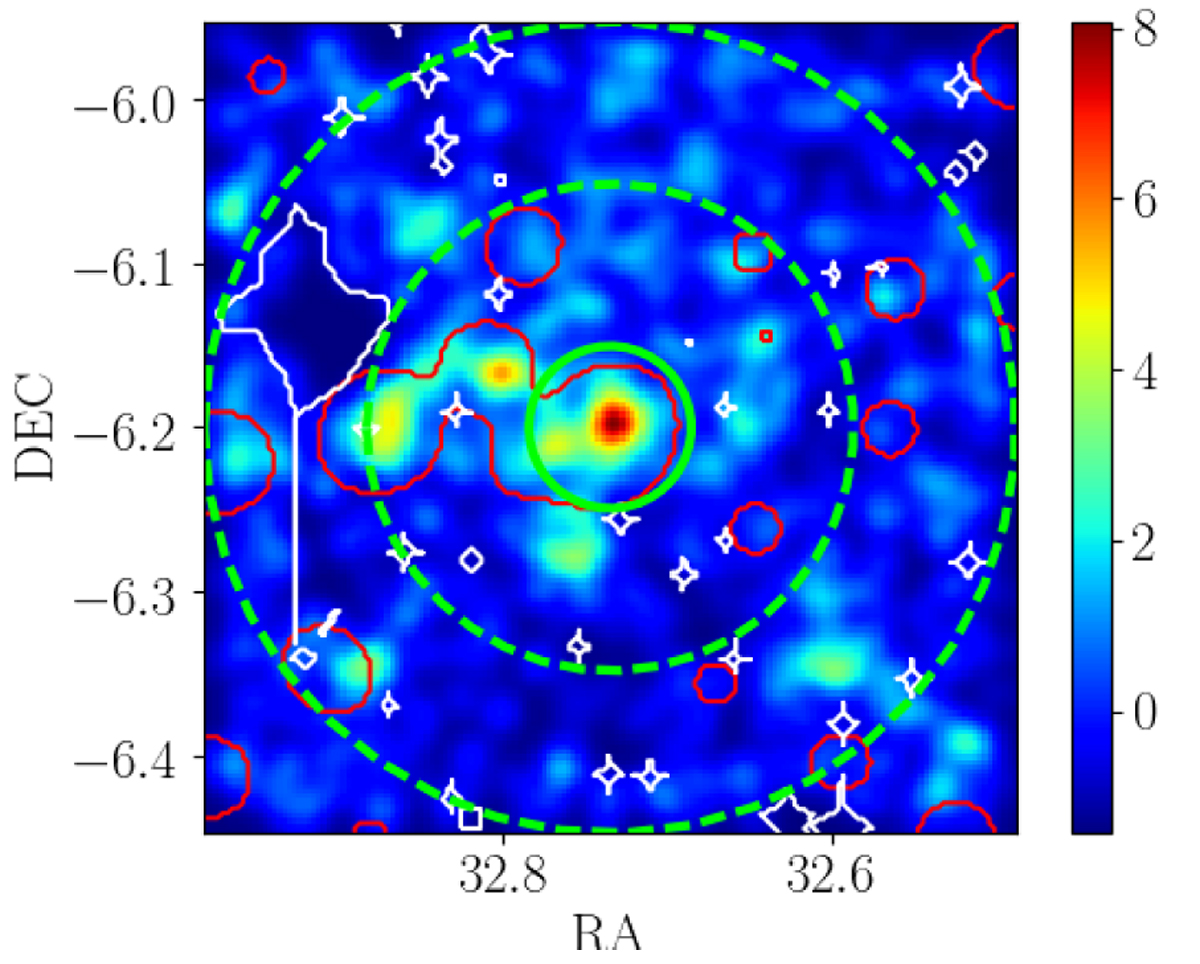
Example of a density map of a cluster 10 × 10 Mpc2 field, constructed using a Gaussian kernel of width σ = 0.1875 Mpc. The colourbar reflects the signal-to-noise ration (S/N). Only galaxies with m < m* + 3 (or L >0.06 L*) are selected and the photometric redshift width depends on the galaxy magnitudes and is taken to ensure 68% completeness. The red contours indicate the structures detected by wazp, and the white ones show the masked regions. The green inner circle shows 1 Mpc around the cluster X-ray centre and the dashed green lines delimitate the local background field from 3 to 5 Mpc. NB: we can see that this cluster is part of a superstructure.
Current usage metrics show cumulative count of Article Views (full-text article views including HTML views, PDF and ePub downloads, according to the available data) and Abstracts Views on Vision4Press platform.
Data correspond to usage on the plateform after 2015. The current usage metrics is available 48-96 hours after online publication and is updated daily on week days.
Initial download of the metrics may take a while.