Fig. 5
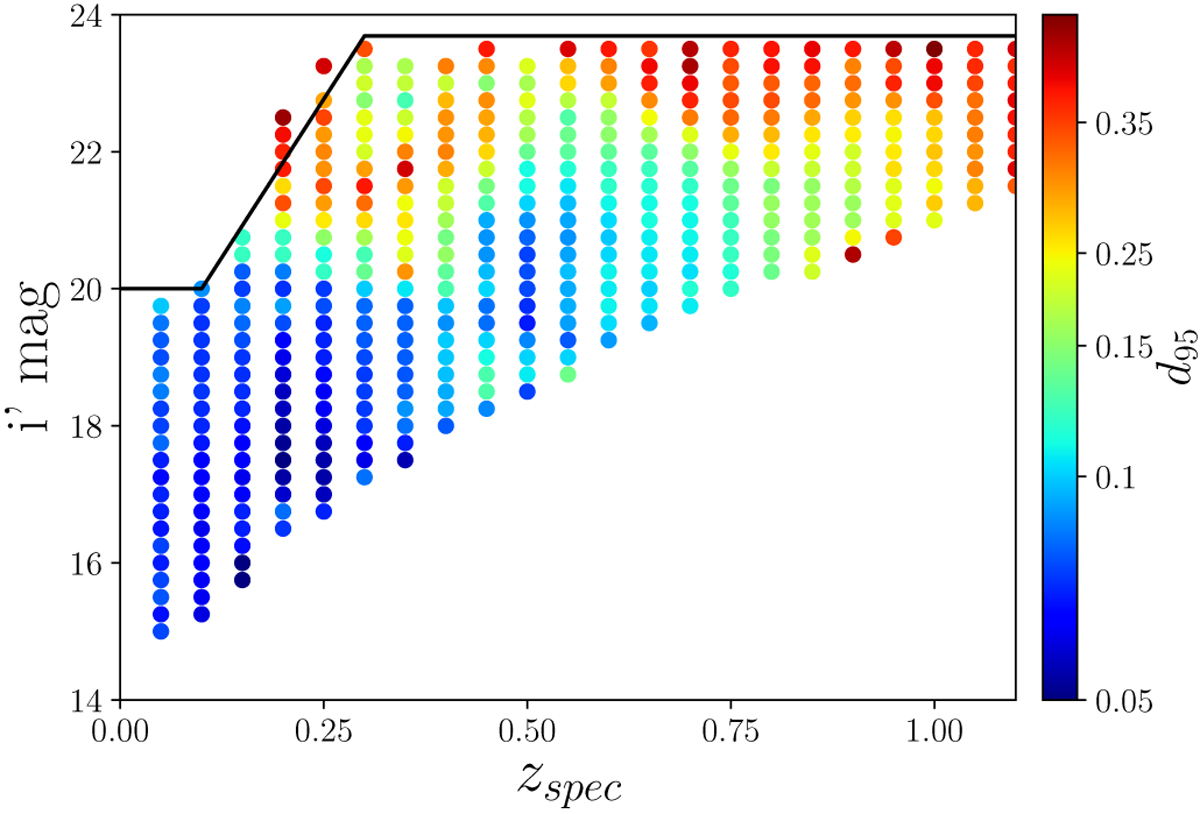
Photometric redshift dispersion d95, computed as the 95th percentile of |zphot − zspec −bias(zspec)| in the (z, i′mag) plane. The dots indicate the centres of the Δ(z, i′mag) = 0.1 × 0.5 cells used to compute the dispersion (if they contain at least 30 objects). The continuous black line shows the limiting magnitude we impose for the rest of the study.
Current usage metrics show cumulative count of Article Views (full-text article views including HTML views, PDF and ePub downloads, according to the available data) and Abstracts Views on Vision4Press platform.
Data correspond to usage on the plateform after 2015. The current usage metrics is available 48-96 hours after online publication and is updated daily on week days.
Initial download of the metrics may take a while.