Fig. 3
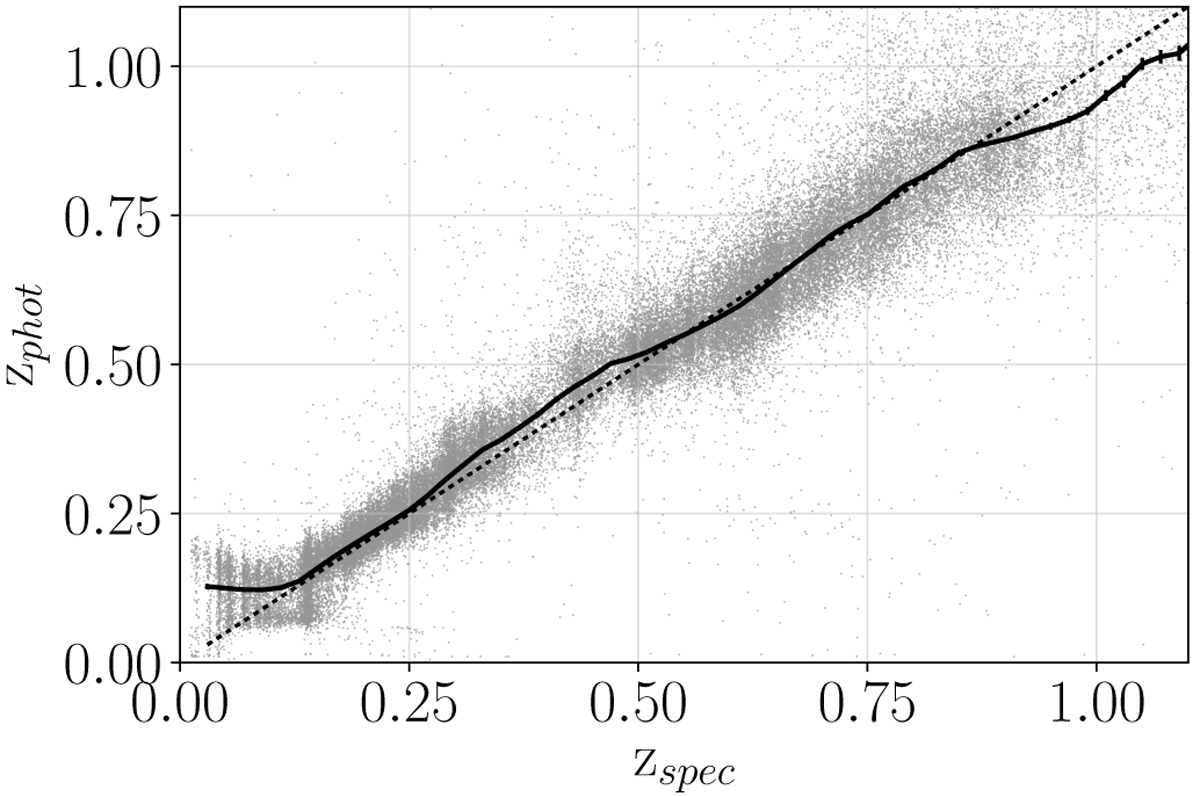
Relation between the photometric and spectroscopic redshifts, including all objects with a secure spectroscopic measurement (see text). Each grey point represents a galaxy; the black line indicates the bias b(zspec) and its error (only distinguishable at high redshift), which was computed assuming a normal distribution. The dot-dashed black lines indicates zphot = zspec for visualisation purposes.
Current usage metrics show cumulative count of Article Views (full-text article views including HTML views, PDF and ePub downloads, according to the available data) and Abstracts Views on Vision4Press platform.
Data correspond to usage on the plateform after 2015. The current usage metrics is available 48-96 hours after online publication and is updated daily on week days.
Initial download of the metrics may take a while.