Open Access
Fig. 18
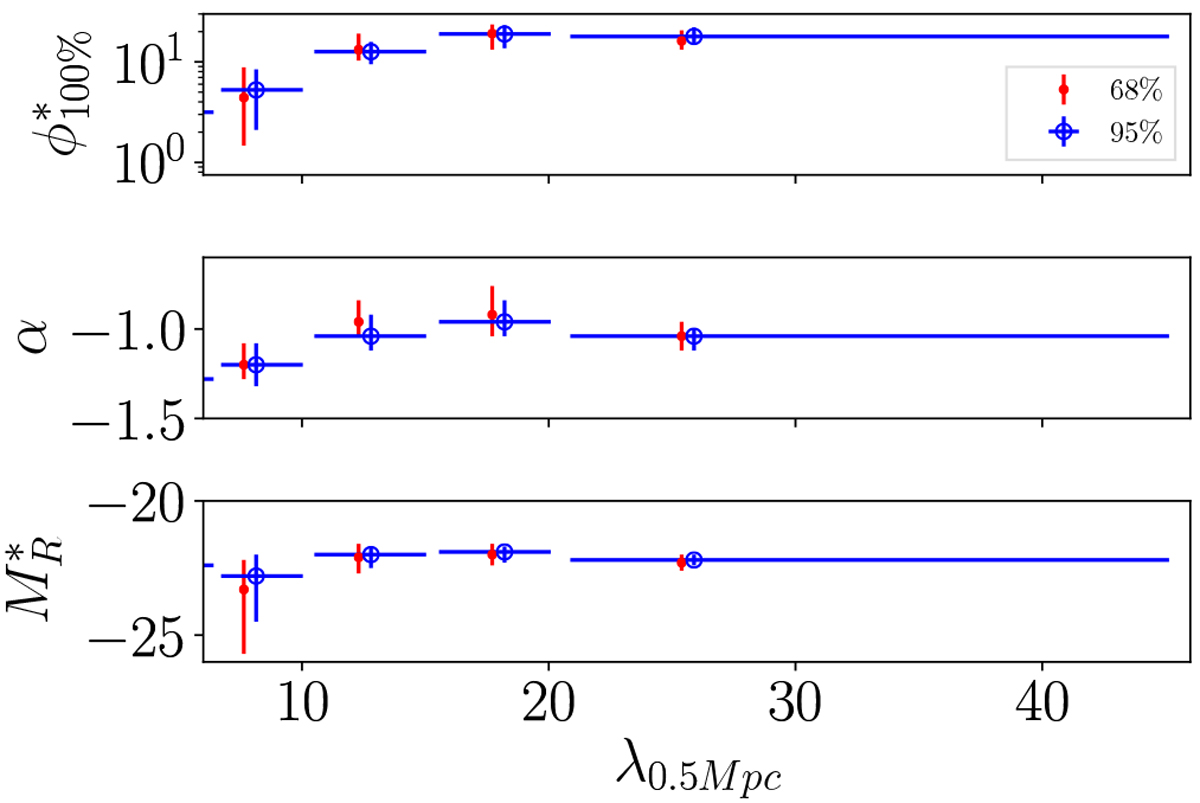
Evolution of the composite cluster luminosity functions parameters with richness for two different dispersion widths, as indicated in the legend. The vertical error bars indicate 68% c.i., whereas the horizontal ones reflect the bin sizes. The points have been slightly shifted in richness for clarity.
Current usage metrics show cumulative count of Article Views (full-text article views including HTML views, PDF and ePub downloads, according to the available data) and Abstracts Views on Vision4Press platform.
Data correspond to usage on the plateform after 2015. The current usage metrics is available 48-96 hours after online publication and is updated daily on week days.
Initial download of the metrics may take a while.