Fig. 15
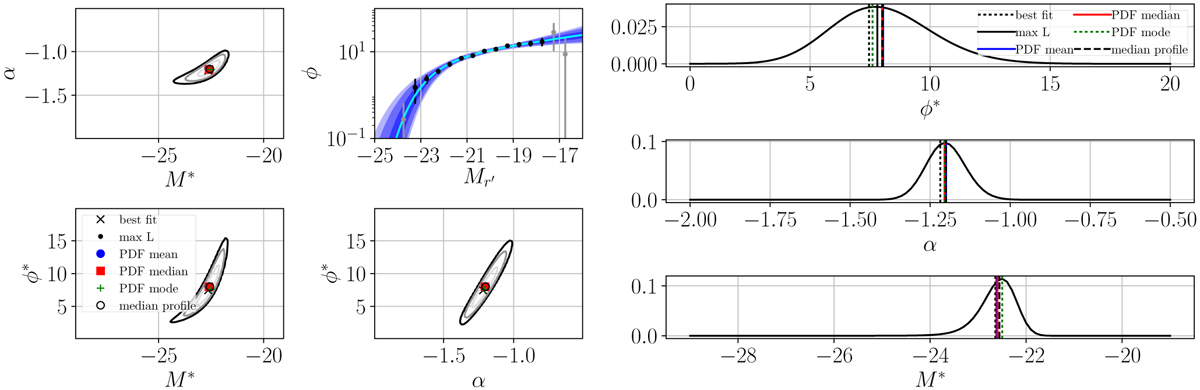
Illustration of the composite luminosity function fitting procedure for a sample of 121 clusters (general sample in Sect. 5). Left panels: 2D marginalised likelihoods of the Schechter fit parameters, and associated luminosity profile. The contours show the 68, 95, and 99% levels, and the different statistical values are indicated in the legend. Top left: (α, M*) marginalisedover ϕ*. Top right: posterior CLF shape, the data points are shown in grey and black, the median profile is drawn in cyan, and the blue shaded regions indicate the 68, 95, and 99% c.i. Bottom left: (ϕ*, M*) marginalisedon α. Bottom right: (ϕ*, α) marginalisedon M*. Right panels: probability density functions of the Schechter fit parameters after marginalisation. The lines show the different statistical values, as indicated in the legend. In this sample the different statistical estimators give indistinguishable values.
Current usage metrics show cumulative count of Article Views (full-text article views including HTML views, PDF and ePub downloads, according to the available data) and Abstracts Views on Vision4Press platform.
Data correspond to usage on the plateform after 2015. The current usage metrics is available 48-96 hours after online publication and is updated daily on week days.
Initial download of the metrics may take a while.