Fig. 13
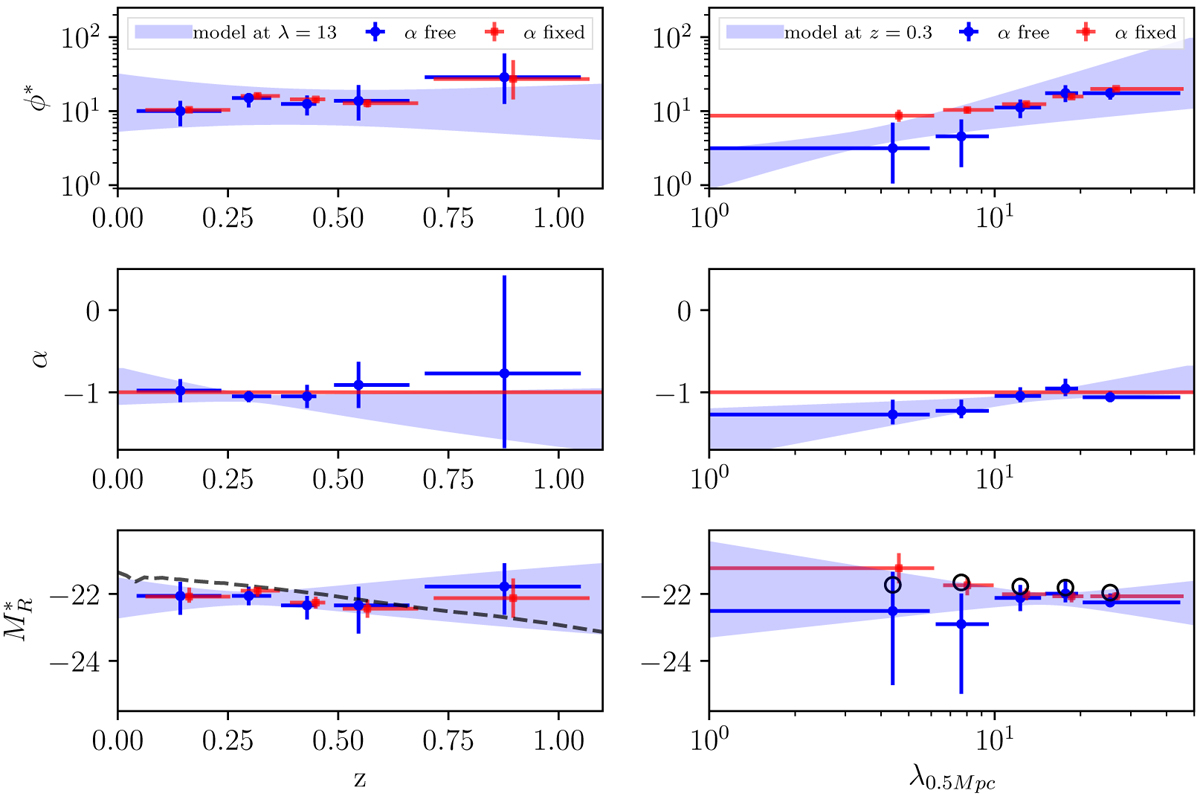
Parameters of the composite cluster luminosity functions computed in increasing bins of redshift (left panel) and richness (right panel). From top to bottom, the plots show the normalisation ϕ*, the faint endslope α, and the characteristic magnitude ![]() . The vertical error bars indicate the 68% c.i., whereas the horizontal ones reflect the bin size. The blue (red) points indicate the results when the faint end slope is free (fixed). The shaded blue regions show the evolution models we constrained from Eq. (10) at fixed richness (λ0.5 Mpc = 13, left panel) and redshift (z = 0.3, right panel). The dashed black line shows a fiducial model for the evolution of M*; the black circles indicate the model values at the median redshifts of the richness bins.
. The vertical error bars indicate the 68% c.i., whereas the horizontal ones reflect the bin size. The blue (red) points indicate the results when the faint end slope is free (fixed). The shaded blue regions show the evolution models we constrained from Eq. (10) at fixed richness (λ0.5 Mpc = 13, left panel) and redshift (z = 0.3, right panel). The dashed black line shows a fiducial model for the evolution of M*; the black circles indicate the model values at the median redshifts of the richness bins.
Current usage metrics show cumulative count of Article Views (full-text article views including HTML views, PDF and ePub downloads, according to the available data) and Abstracts Views on Vision4Press platform.
Data correspond to usage on the plateform after 2015. The current usage metrics is available 48-96 hours after online publication and is updated daily on week days.
Initial download of the metrics may take a while.