Fig. 11
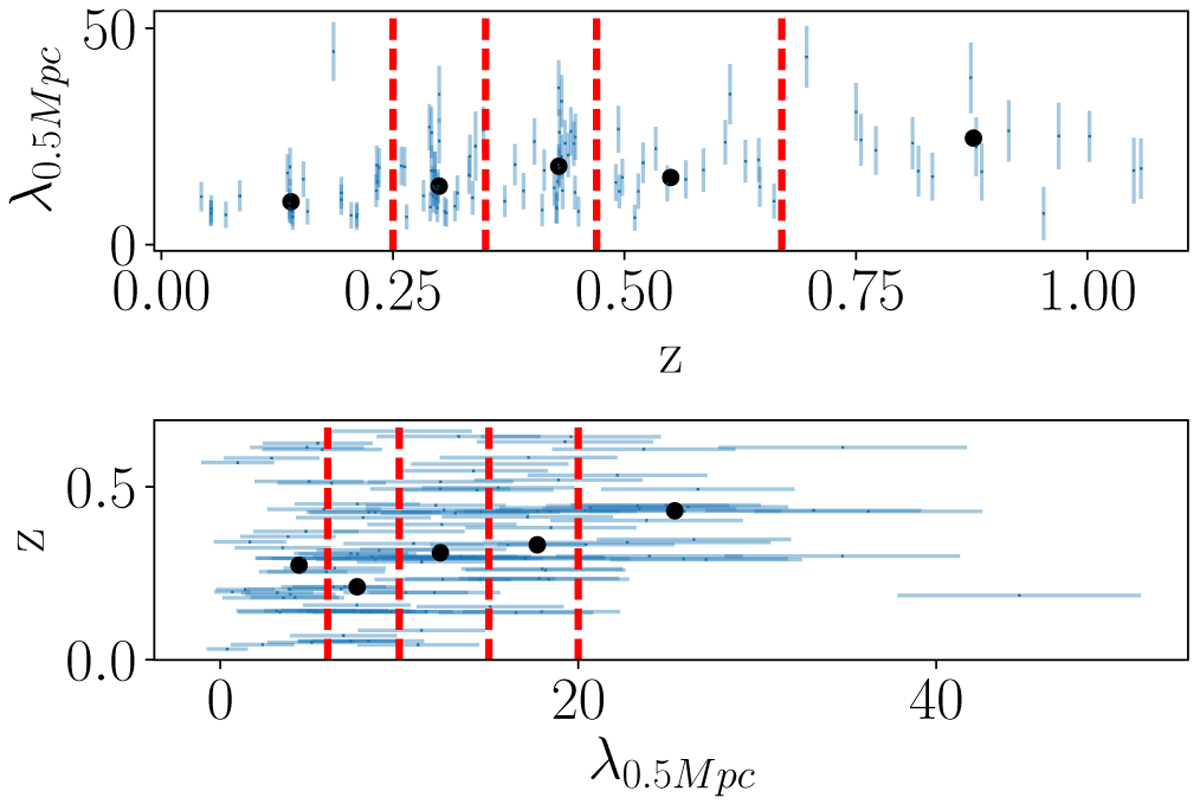
Illustration of the CLF bin limits. Measurements for individual clusters are represented by the grey error bars. Bin delimitations are indicated by the red dashed lines. Top panel: richness in 0.5 Mpc as a function of redshift, with a minimum richness of 6. The black dots indicate the median values of the richness in each redshift bin. Bottom panel: redshift as a function of the richness in 0.5 Mpc, with a maximum redshift of 0.67. The black dots indicate the median redshift value in each richness bin.
Current usage metrics show cumulative count of Article Views (full-text article views including HTML views, PDF and ePub downloads, according to the available data) and Abstracts Views on Vision4Press platform.
Data correspond to usage on the plateform after 2015. The current usage metrics is available 48-96 hours after online publication and is updated daily on week days.
Initial download of the metrics may take a while.