Fig. 9
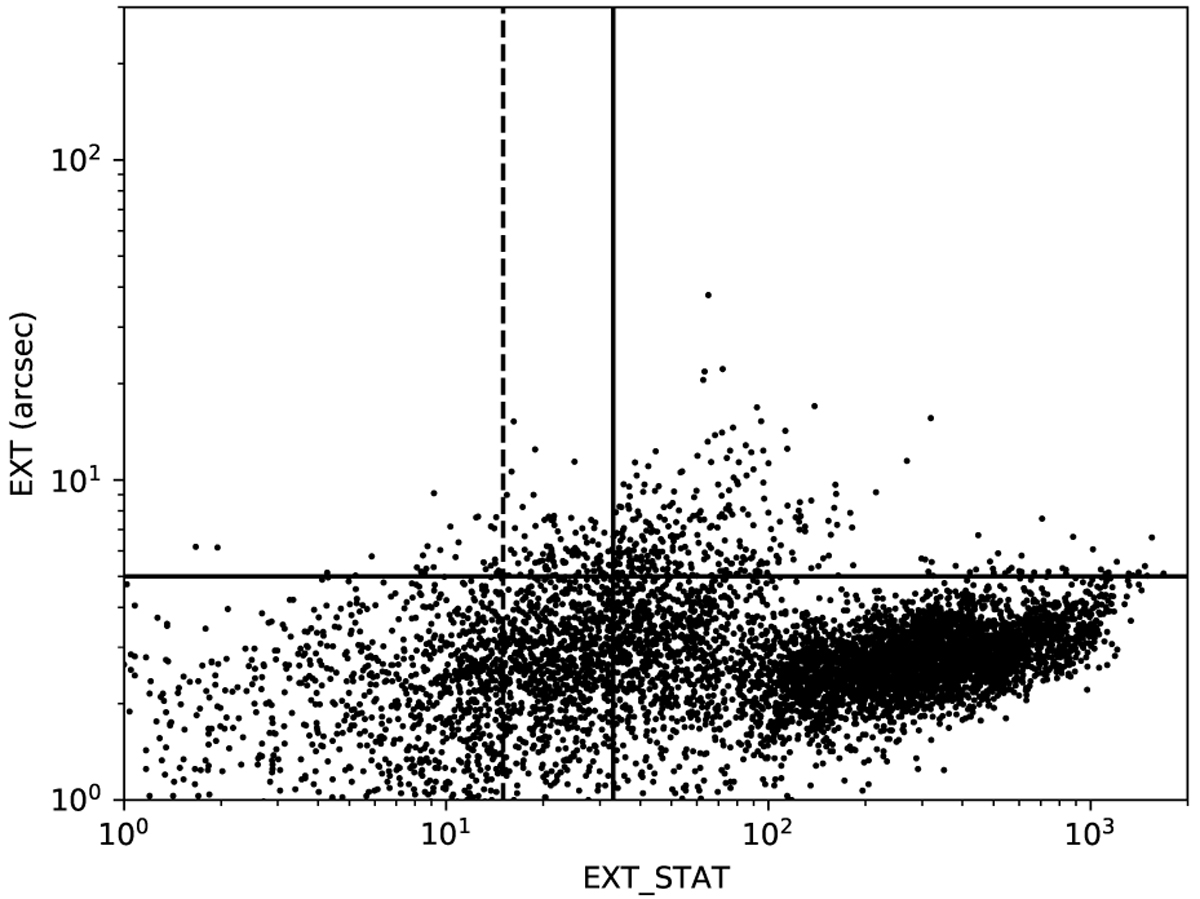
EXT vs. EXT_STAT plane for recovered clusters contaminated by a central AGN (AC). The continuous line at EXT_STAT = 33 shows the cut for the C1 selection, and the dashed line at EXT_STAT = 15 shows the cut for the C2 selection. The figure shows that many clusters are no longer identified as C1, or even as C2, because of the central AGN contamination.
Current usage metrics show cumulative count of Article Views (full-text article views including HTML views, PDF and ePub downloads, according to the available data) and Abstracts Views on Vision4Press platform.
Data correspond to usage on the plateform after 2015. The current usage metrics is available 48-96 hours after online publication and is updated daily on week days.
Initial download of the metrics may take a while.