Fig. 8
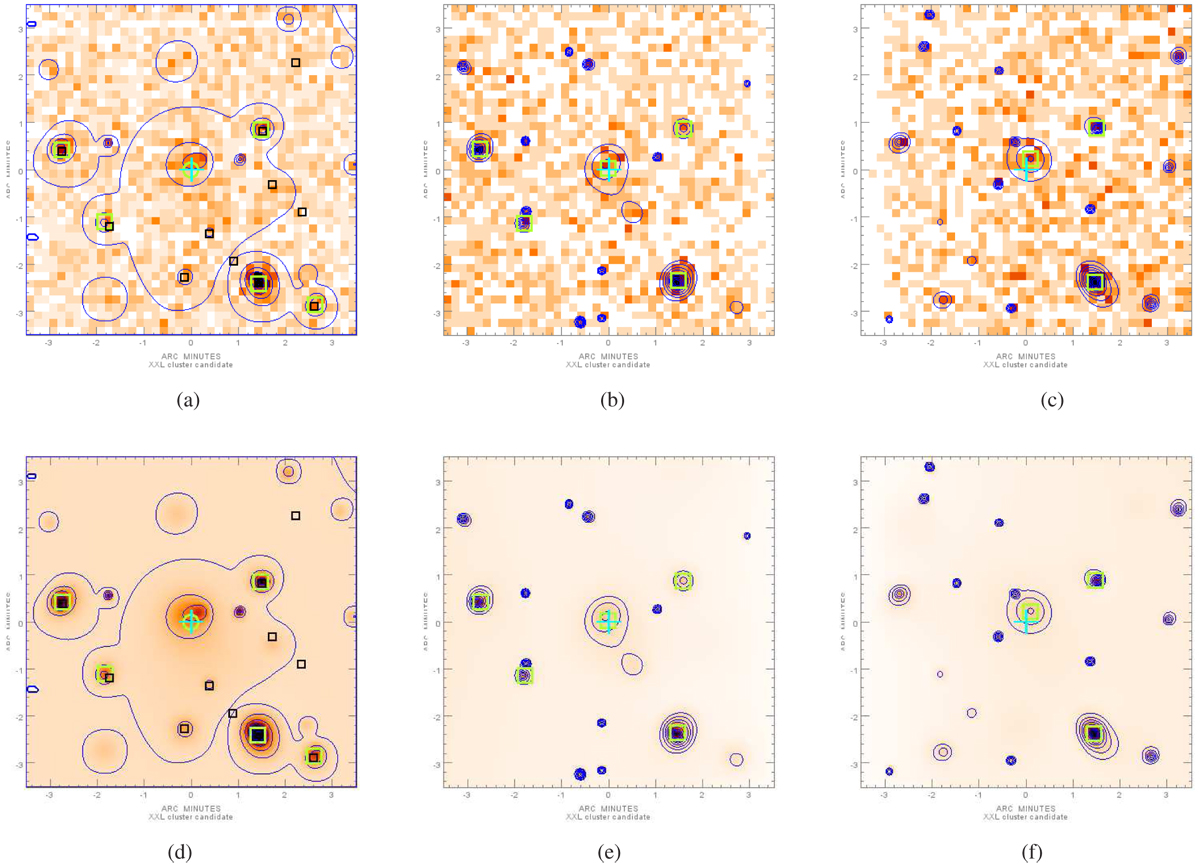
Using tiles allows us to recover a cluster that would be missed using separatepointings. In all images a green circle indicates an extended source (C1 or C2 detection) and a green square a source that is significant (PNT_DET_STAT > 15) but which cannot be securely identified as point-like or extended; the cyan cross shows the position of the recovered cluster and the black squares in the left panels the position of the input AGNs; X-ray contours are also shown. Panel a: combined photon image. Panel b: photon image of one of the pointings. Panel c: photon image of the other pointing. Panel d: combined wavelet image. Panel e: wavelet image of one of the pointings. Panel f: wavelet image of the other pointing.
Current usage metrics show cumulative count of Article Views (full-text article views including HTML views, PDF and ePub downloads, according to the available data) and Abstracts Views on Vision4Press platform.
Data correspond to usage on the plateform after 2015. The current usage metrics is available 48-96 hours after online publication and is updated daily on week days.
Initial download of the metrics may take a while.