Fig. 7
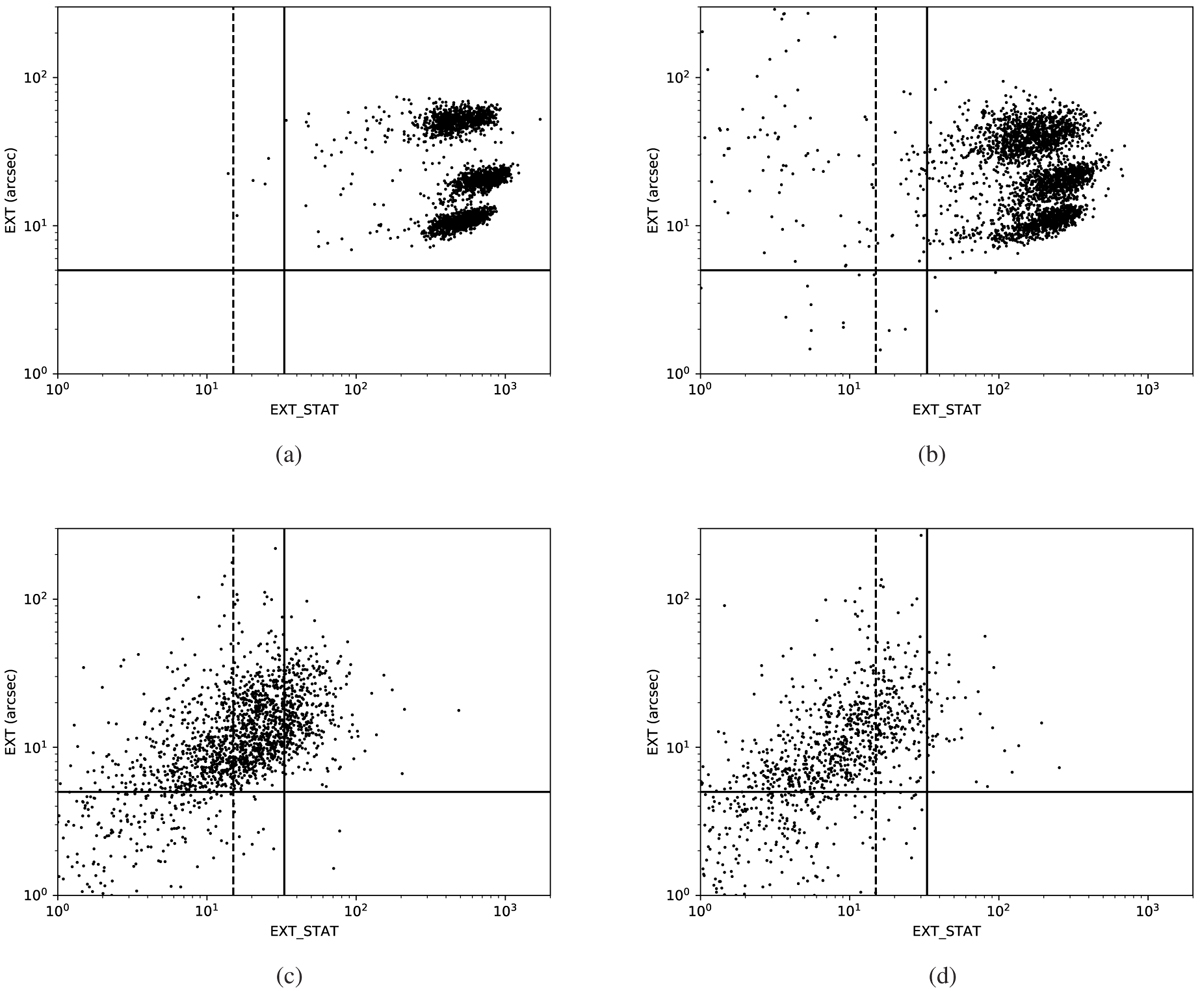
EXT vs. EXT_STAT plane for recovered clusters where clusters have been separated by input count rate. The continuous line at EXT_STAT = 33 shows the cut for the C1 selection and the dashed line at EXT_STAT = 15 shows the cut for the C2 selection. The continuous line at ext =5′′ shows the cut in extent for both the C1 and C2 selections. If a source is found in more than one tile, the detection with the highest value of EXT_STAT is shown. Panel a: tiles; input count rate 0.1 count s-1. Panel b: tiles; input count rate 0.05 count s-1. Panel c: tiles; input count rate 0.01 count s-1. Panel d: tiles; input count rate 0.005 count s-1.
Current usage metrics show cumulative count of Article Views (full-text article views including HTML views, PDF and ePub downloads, according to the available data) and Abstracts Views on Vision4Press platform.
Data correspond to usage on the plateform after 2015. The current usage metrics is available 48-96 hours after online publication and is updated daily on week days.
Initial download of the metrics may take a while.