Fig. 2
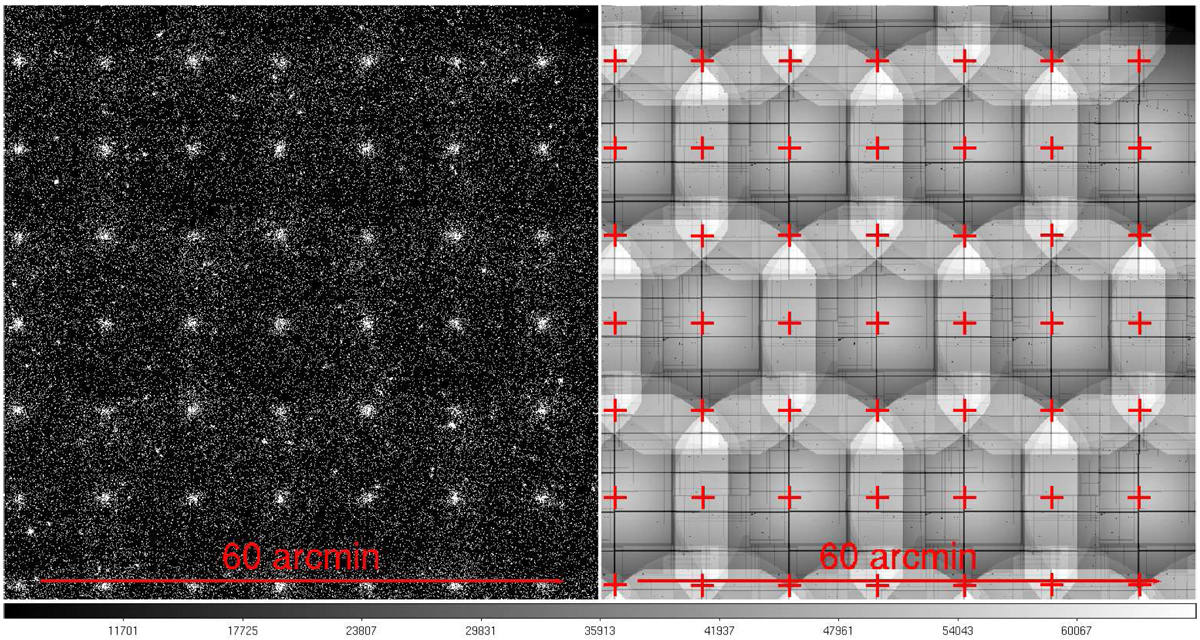
Examples of a simulated tile and its corresponding tiled exposure map. Left panel: mosaic (MOS1+MOS2+pn) raw X-ray tile, comprising ≈25 overlapping pointings. Sources in the tile include both clusters (larger sources regularly spaced by 10′) all with count rates of 0.1 count s-1 and core radius 20′′, and resolved AGNs inserted at random positions; background is added. A wavelet smoothed image of the same area is shown in Fig. 3. Right panel: combined (MOS1+MOS2 + 3.1×pn) tiled exposure map of the same region. Red crosses show the cluster positions. A nominal XMM-LSS exposure time 10 ks for each instrument is assumed in both panels. The exposure map is in MOS units: the pn exposure map is corrected for the larger pn effective area by multiplying it by 3.1 (see text) so the combined exposure map has an exposure time ≈50 ks at the pointing centres. The area is the same as that shown in Fig. 1 and the exposure maps in the right panels of both figures are the same.
Current usage metrics show cumulative count of Article Views (full-text article views including HTML views, PDF and ePub downloads, according to the available data) and Abstracts Views on Vision4Press platform.
Data correspond to usage on the plateform after 2015. The current usage metrics is available 48-96 hours after online publication and is updated daily on week days.
Initial download of the metrics may take a while.