Open Access
Fig. 14
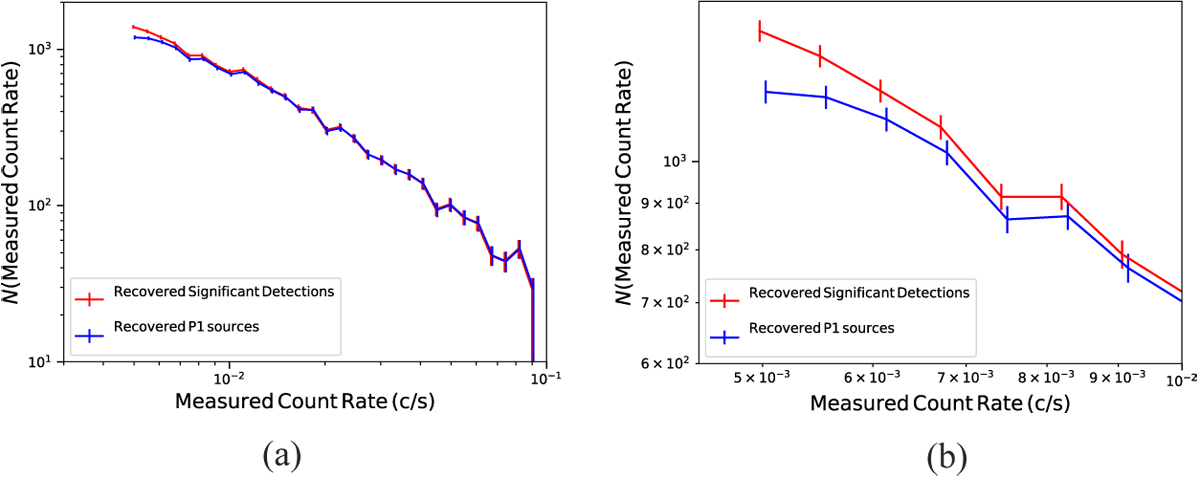
Differential log(N(CR))−log(CR) for recoveredsources. Blue line: all significant detections; red line: P1 detections. The figure shows that the P1 selection is complete down to CR ≈ 0.006 count s-1. Panel a: overall view. Panel b: blow up of the regime where P1 selection becomes incomplete.
Current usage metrics show cumulative count of Article Views (full-text article views including HTML views, PDF and ePub downloads, according to the available data) and Abstracts Views on Vision4Press platform.
Data correspond to usage on the plateform after 2015. The current usage metrics is available 48-96 hours after online publication and is updated daily on week days.
Initial download of the metrics may take a while.