Open Access
Fig. 12
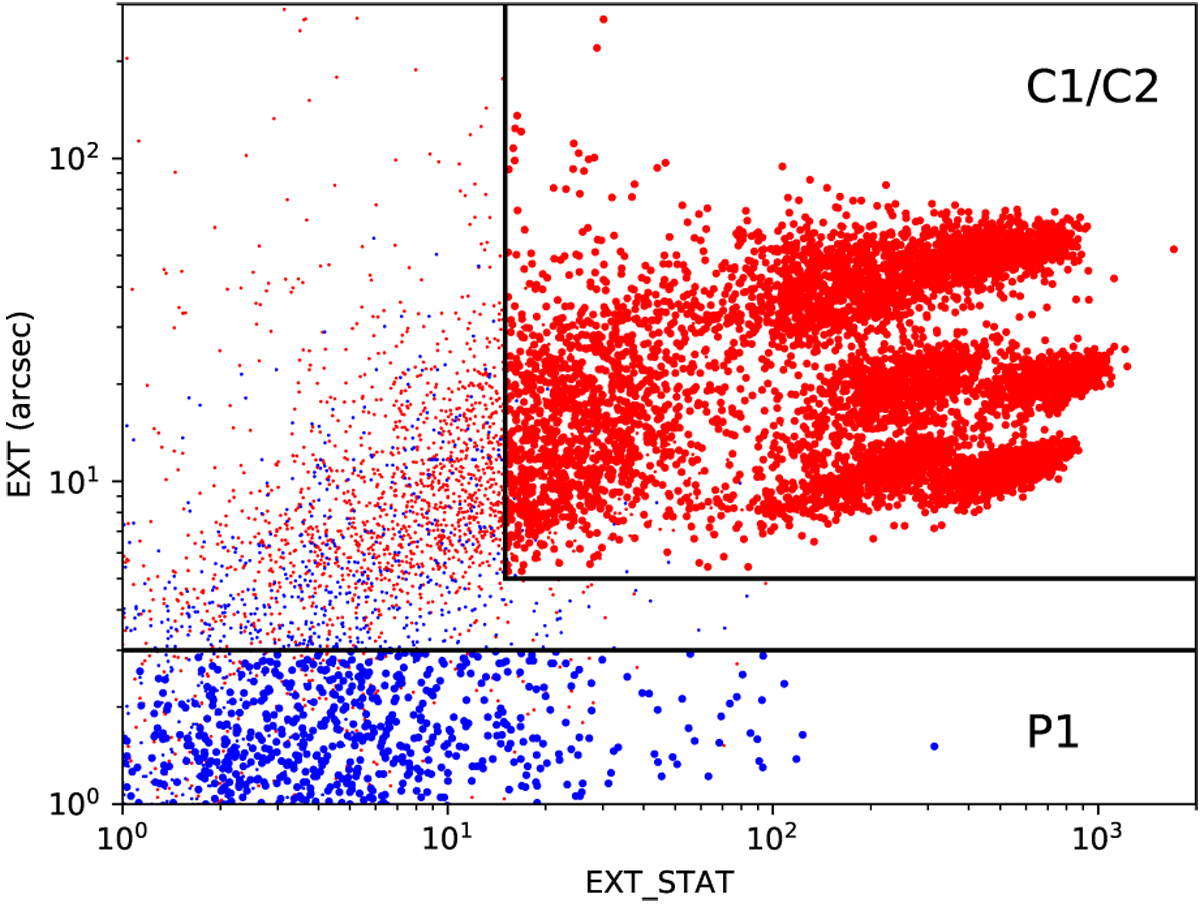
EXT vs. EXT_STAT plane for recovered clusters (red) and AGNs (blue). The boxes indicate the C1∕C2 and P1 selection regions, respectively. Sources identified as either C1∕C2 or P1 are shown with larger points than the others.
Current usage metrics show cumulative count of Article Views (full-text article views including HTML views, PDF and ePub downloads, according to the available data) and Abstracts Views on Vision4Press platform.
Data correspond to usage on the plateform after 2015. The current usage metrics is available 48-96 hours after online publication and is updated daily on week days.
Initial download of the metrics may take a while.