Open Access
Fig. 10
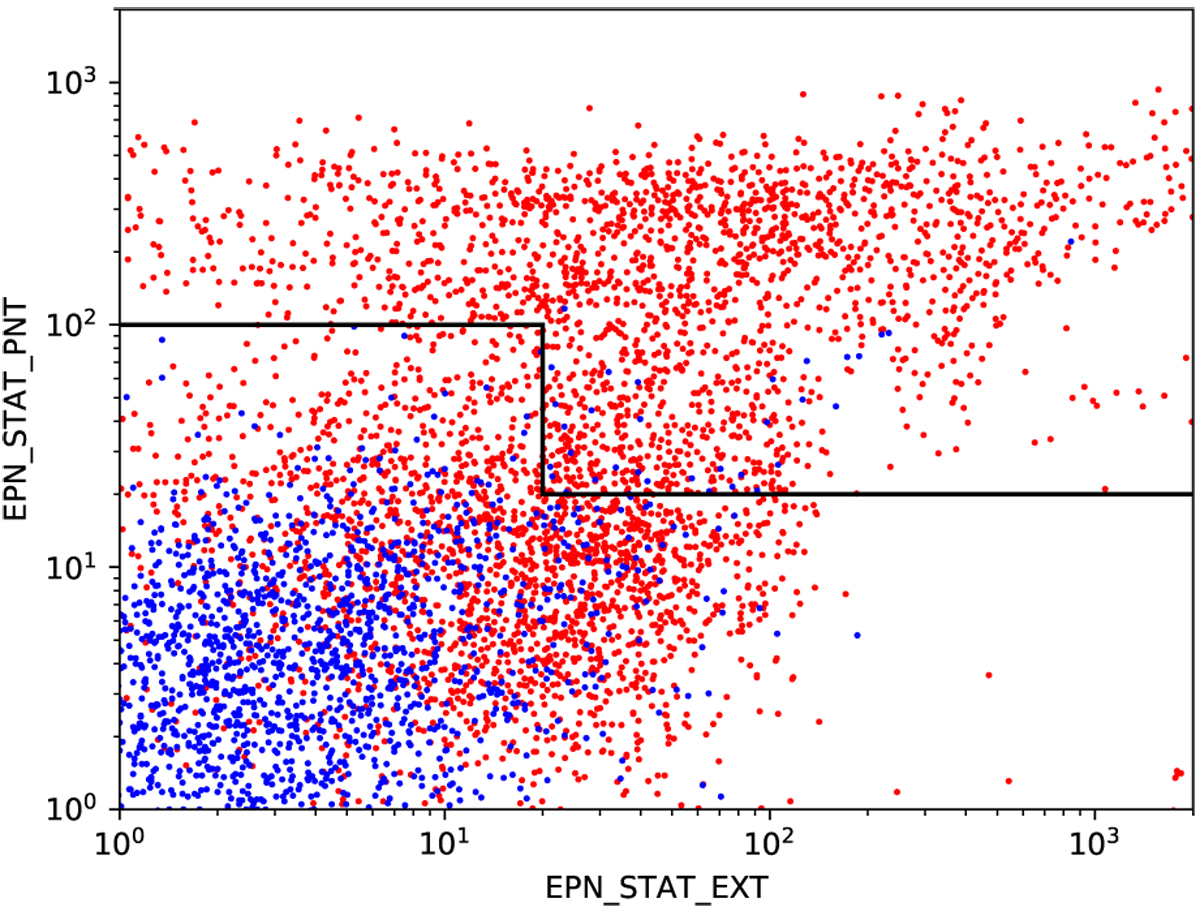
EPN_STAT_PNT vs. EPN_STAT_EXT plane for clusters contaminated by a central AGN (red) and AGNs (blue). The continuous lines show the cuts for the AC selection. The figure shows that AC clusters may be recovered by applying the AC selection.
Current usage metrics show cumulative count of Article Views (full-text article views including HTML views, PDF and ePub downloads, according to the available data) and Abstracts Views on Vision4Press platform.
Data correspond to usage on the plateform after 2015. The current usage metrics is available 48-96 hours after online publication and is updated daily on week days.
Initial download of the metrics may take a while.