Fig. 1
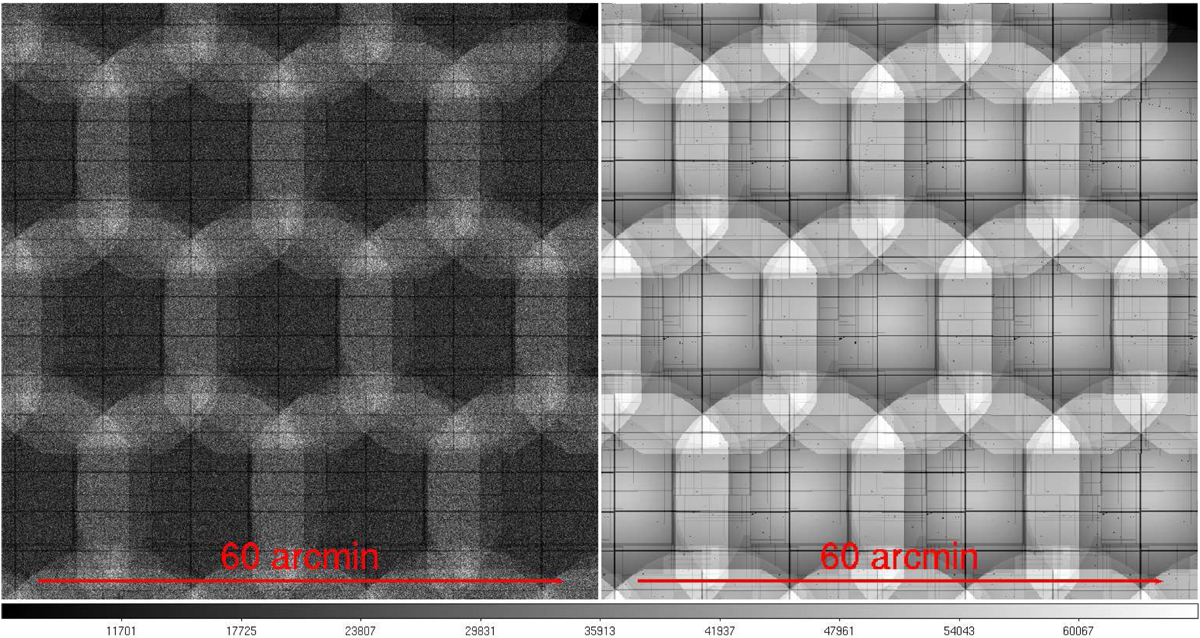
Left panel: example of particle background model subtracted from a 68′ × 68′ tile. Right panel: tiled combined exposure map (MOS1+MOS2 + 3.1×pn) of the same region. A nominal XMM-LSS exposure time 10 ks for each instrument is assumed. The map is in MOS units: the pn exposure map is corrected for the larger pn effective area by multiplying it by 3.1 (see text) so the combined exposure map has an exposure time ≈50 ks at the pointing centres. The exposure time is even larger (≈60 ks) in areas where three pointings overlap.
Current usage metrics show cumulative count of Article Views (full-text article views including HTML views, PDF and ePub downloads, according to the available data) and Abstracts Views on Vision4Press platform.
Data correspond to usage on the plateform after 2015. The current usage metrics is available 48-96 hours after online publication and is updated daily on week days.
Initial download of the metrics may take a while.