| Issue |
A&A
Volume 620, December 2018
|
|
|---|---|---|
| Article Number | C4 | |
| Number of page(s) | 1 | |
| Section | Extragalactic astronomy | |
| DOI | https://doi.org/10.1051/0004-6361/201832887e | |
| Published online | 14 December 2018 | |
Molecular gas in two companion cluster galaxies at z = 1.2 (Corrigendum)
1 Sorbonne Université, Observatoire de Paris, Université PSL, CNRS, LERMA, 75014 Paris, France
e-mail: This email address is being protected from spambots. You need JavaScript enabled to view it.
2 Collège de France, 11 Place Marcelin Berthelot, 75231 Paris, France
3 INAF-Osservatorio Astronomico di Brera, via Brera 28, 20121 Milano, Italy
4 Department of Physics, Ludwig-Maximilians-Universität, Scheinerstr. 1, 81679 München, Germany
5 Astrophysics, Department of Physics, University of Oxford, Keble Road, Oxford OX1 3RH, UK
6 Department of Physics and Electronics, Rhodes University, PO Box 94 Grahamstown, 6140, South Africa
7 International Centre for Radio Astronomy Research, University of Western Australia M468, 35 Stirling Highway, Crawley, WA 6009, Australia
8 National Radio Astronomy Observatory, PO Box O Socorro, NM 87801, USA
9 Institute of Physics, Laboratory of Astrophysics, Ecole Polytechnique Fédérale de Lausanne (EPFL), Observatoire de Sauverny, 1290 Versoix, Switzerland
Key words: galaxies: clusters: individual: ISCS J1426.5+3339 / galaxies: clusters: general / galaxies: star formation / molecular data / errata, addenda
In Fig. 1 (bottom) and Fig. 2 (left) of Castignani et al. (2018) we report the contour plot and the density map, respectively, associated with the NOEMA detection of CO(2-1) from two cluster galaxies at z = 1.2, unresolved by the NOEMA observations. However, the projected space coordinates of both the contour plot and the density map are transposed. We report in Fig. 1 the corrected figures. Since the detection is coincident with the phase center of the observation, that is invariant under coordinate transposition in the figures, all other results presented in the original manuscript are unchanged.
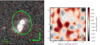 |
Fig. 1. Left and right panels correspond to Fig. 1 (bottom) and Fig. 2 (left) of Castignani et al. (2018), respectively. The original figures are corrected for the mistake in the coordinates, as described in the text. |
References
- Castignani, G., Combes, F., Salomé, P., et al. 2018, A&A, 617, A103 [NASA ADS] [CrossRef] [EDP Sciences] [Google Scholar]
© ESO 2018
All Figures
|
Fig. 1. Left and right panels correspond to Fig. 1 (bottom) and Fig. 2 (left) of Castignani et al. (2018), respectively. The original figures are corrected for the mistake in the coordinates, as described in the text. |
| In the text | |
Current usage metrics show cumulative count of Article Views (full-text article views including HTML views, PDF and ePub downloads, according to the available data) and Abstracts Views on Vision4Press platform.
Data correspond to usage on the plateform after 2015. The current usage metrics is available 48-96 hours after online publication and is updated daily on week days.
Initial download of the metrics may take a while.