Fig. 8
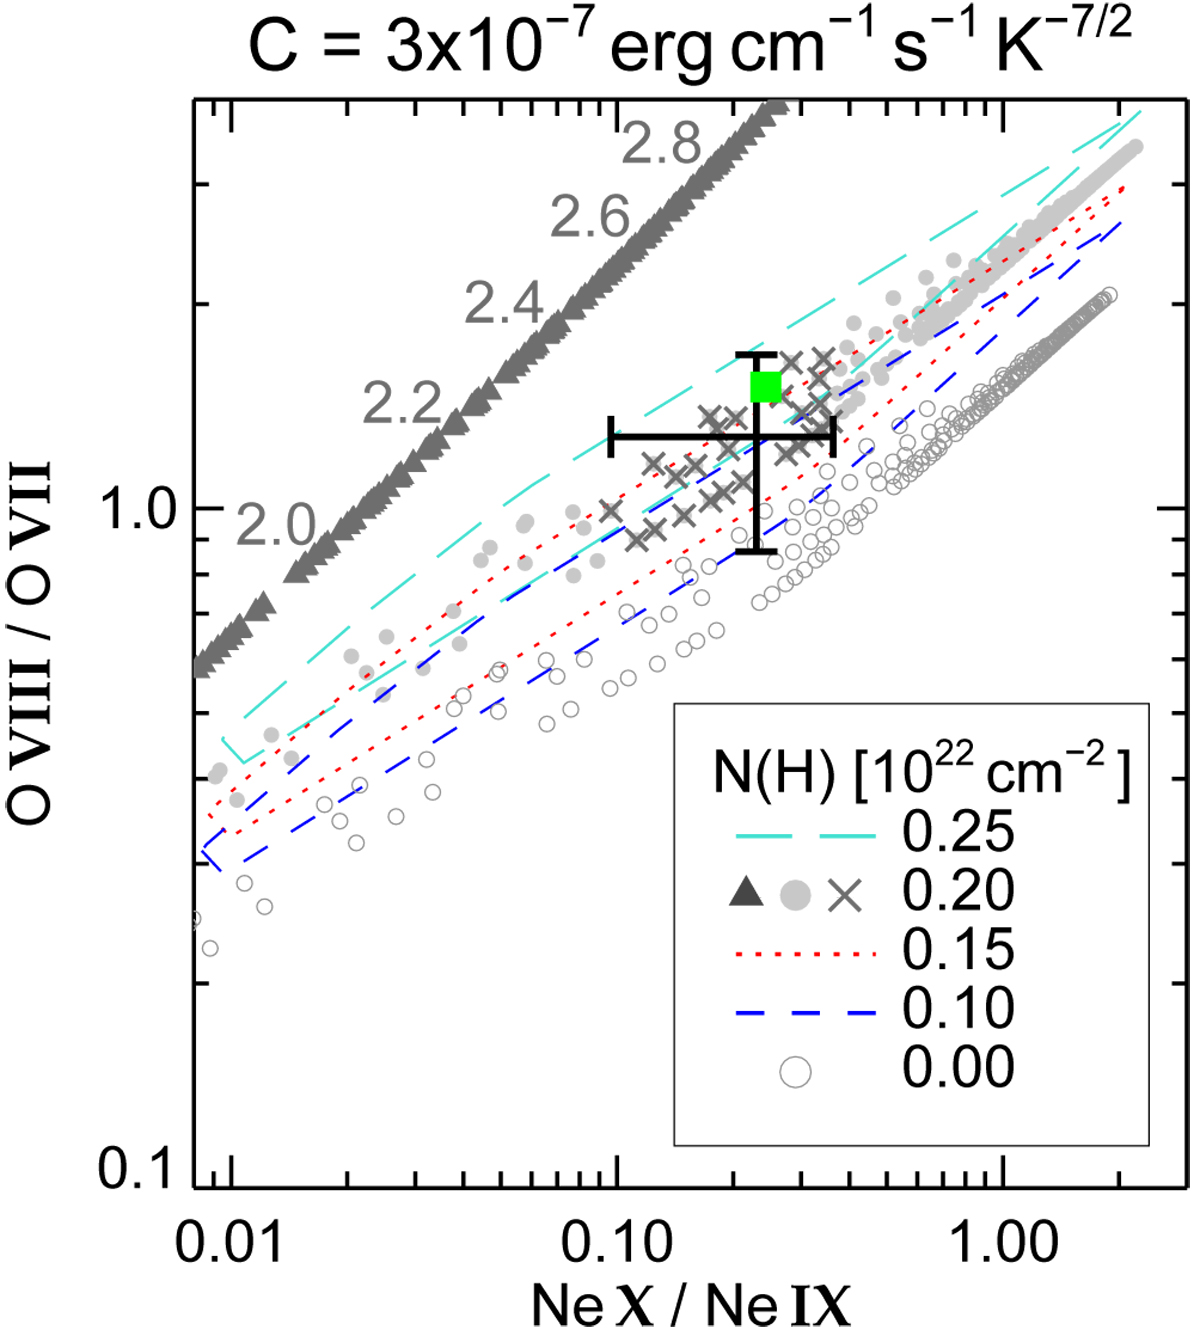
Line ratio of O VIII/O VII over line ratio Ne X/Ne IX for BD +30 (error cross) after Yu et al. (2009, Table 2) and for ZP96 heat-conducting bubbles with homogeneous hydrogen-poor WR composition subject to various absorptions as indicated in the legend. Individual models are only shown for NH = 0 (circles) and NH = 0.20 × 1022 cm−2, the value adopted (grey dots). For other values of NH, only envelopes are given in order to avoid confusion. Evolution proceeds from low to high line ratios, that is, from low to high TX. The oldest (1000 yr) and hottest (4 MK) bubble models always have neon line ratios of about 2, virtually independent of NH. The crosses are the models that lie within BD +30’s error box. The filled square (green) marks our “best-fit” bubble model, presented in Sect. 4.3. The filled triangles are bubbles with constant temperatures (iso-HB, for NH = 0.20 × 1022 cm−2 only, see text for details). The numbers along the iso-HB sequence indicate the bubble temperatures in MK.
Current usage metrics show cumulative count of Article Views (full-text article views including HTML views, PDF and ePub downloads, according to the available data) and Abstracts Views on Vision4Press platform.
Data correspond to usage on the plateform after 2015. The current usage metrics is available 48-96 hours after online publication and is updated daily on week days.
Initial download of the metrics may take a while.