Fig. 5
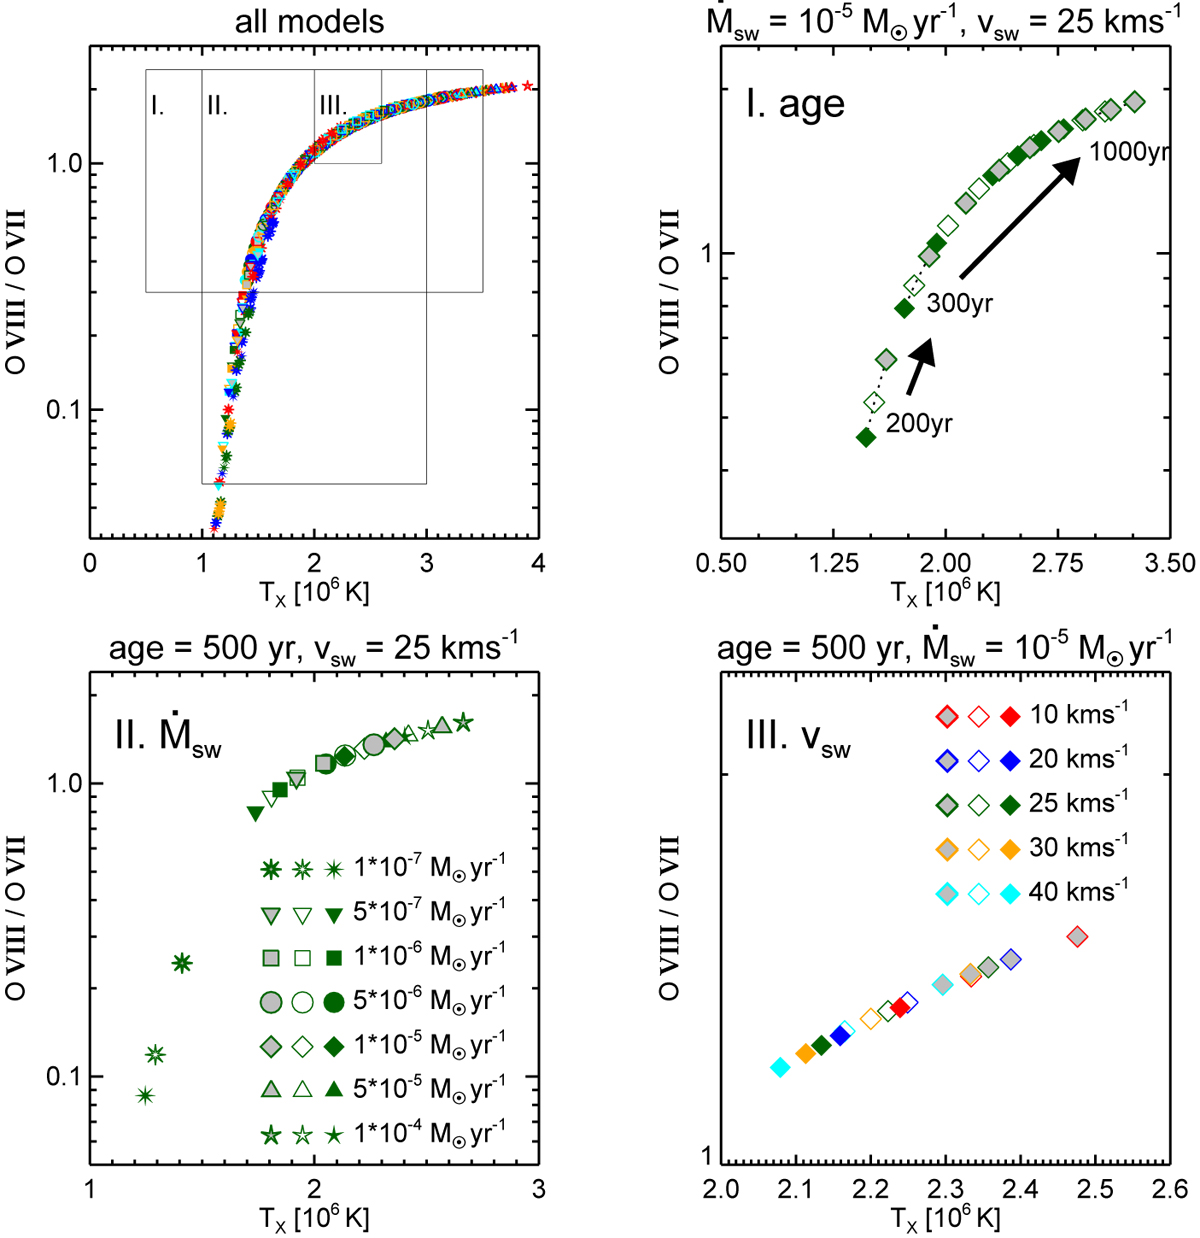
Dependence of the bubble properties in terms of the line ratio O VIII/O VII (18.97 Å/21.60 Å) versus TX on age (panel I), and slow-wind properties (panels II and III). The fixed model parameters are indicated at the top of the respective panels. In each of these three panels, we distinguish between three values of the conduction parameter C: 3.0 × 10⁻⁷ (grey), 4.5 × 10⁻⁷ (open), and 6.0 × 10⁻⁷ erg cm−1 s−1 K7∕2 (filled), as indicated in the legends. Top left panel: all computed bubble models, and the annotated areas (I, II, and III) indicate the plot ranges shown in the respective panels I, II, and III. Without any loss of generality, we selected the WR model shown in Fig. 2, which is close to the middle of the parameter space listed in Table 1, as the reference model. The bubbles’ chemical composition corresponds to the WR case of Table 2.
Current usage metrics show cumulative count of Article Views (full-text article views including HTML views, PDF and ePub downloads, according to the available data) and Abstracts Views on Vision4Press platform.
Data correspond to usage on the plateform after 2015. The current usage metrics is available 48-96 hours after online publication and is updated daily on week days.
Initial download of the metrics may take a while.