Fig. 4
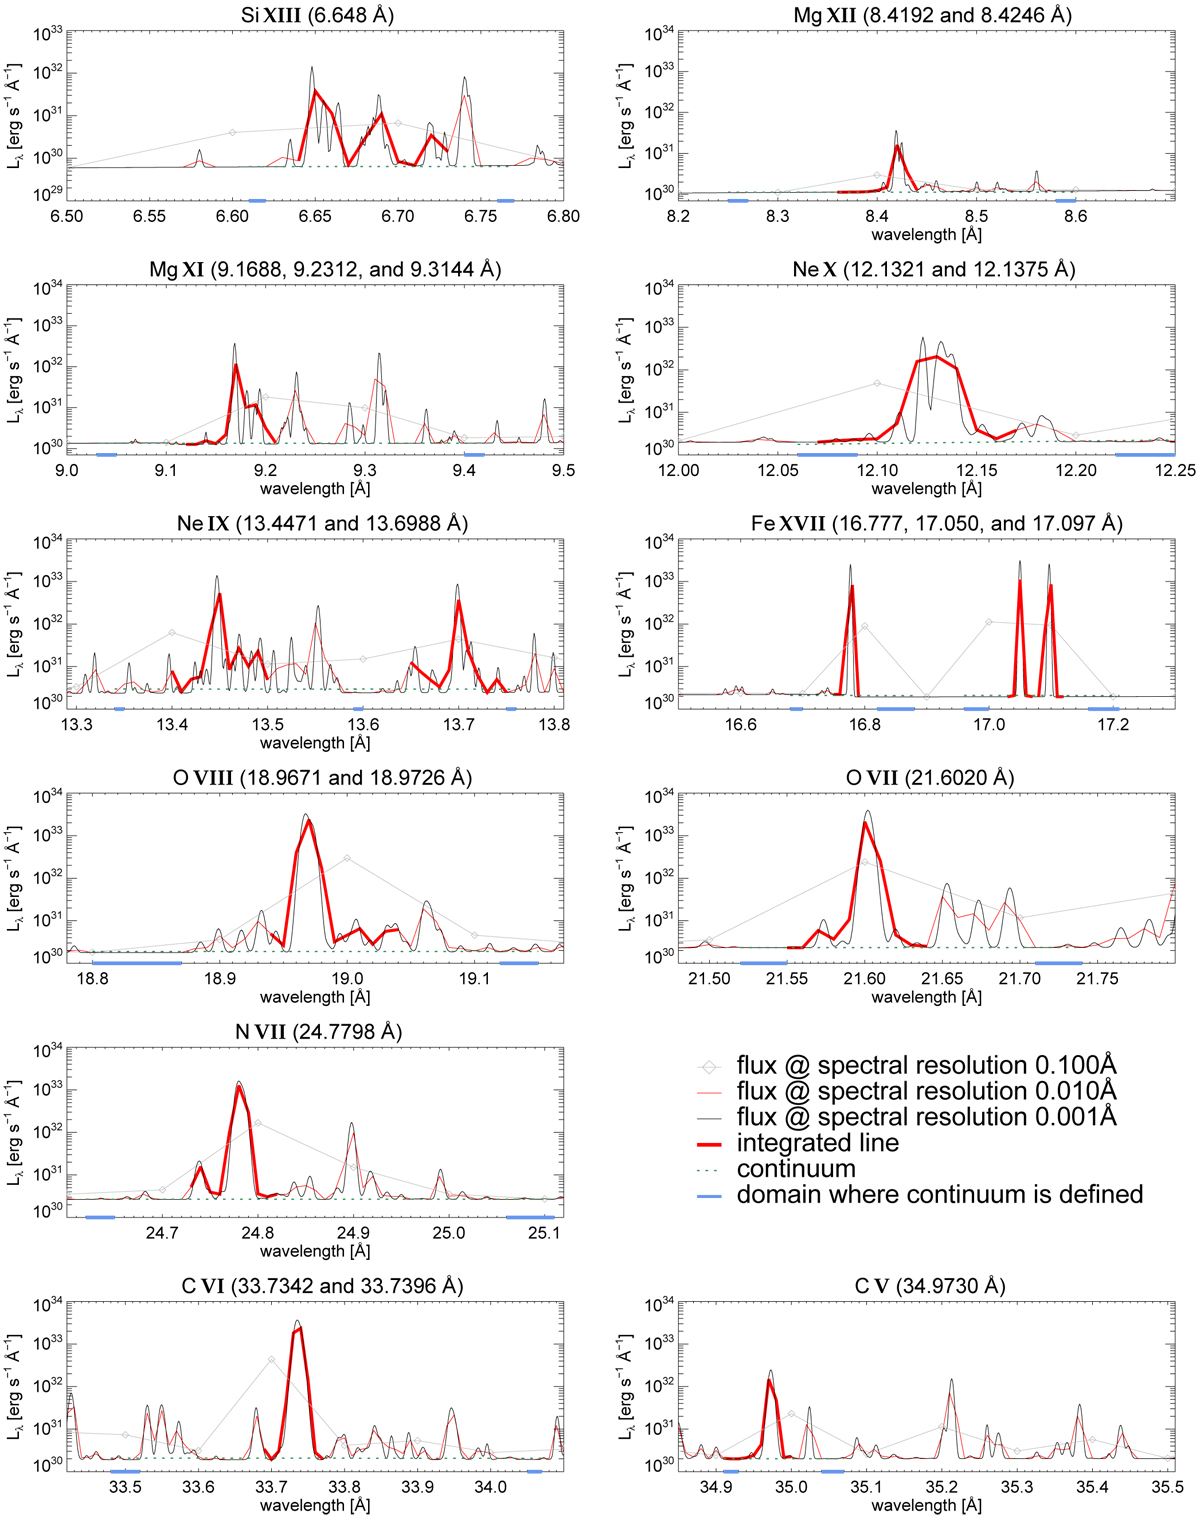
Zoom-in on spectral windows of the CHIANTI output that were considered for our analyses. We note the logarithmic scale on the ordinate and the numerous contributing lines. Without loss of generality, the bubble used is that shown in the top panels of Fig. 2. The hydrogen-rich PN case has been chosen in order to highlight the N VII line, which is virtually absent for the WR composition. We show the spectra at different resolutions (see legend), the spectral range and resolution chosen for the line integration (red), the continuum (short-dashed), and the domains where the continuum is defined for the integrations (blue, on the abscissae).
Current usage metrics show cumulative count of Article Views (full-text article views including HTML views, PDF and ePub downloads, according to the available data) and Abstracts Views on Vision4Press platform.
Data correspond to usage on the plateform after 2015. The current usage metrics is available 48-96 hours after online publication and is updated daily on week days.
Initial download of the metrics may take a while.