Fig. 2
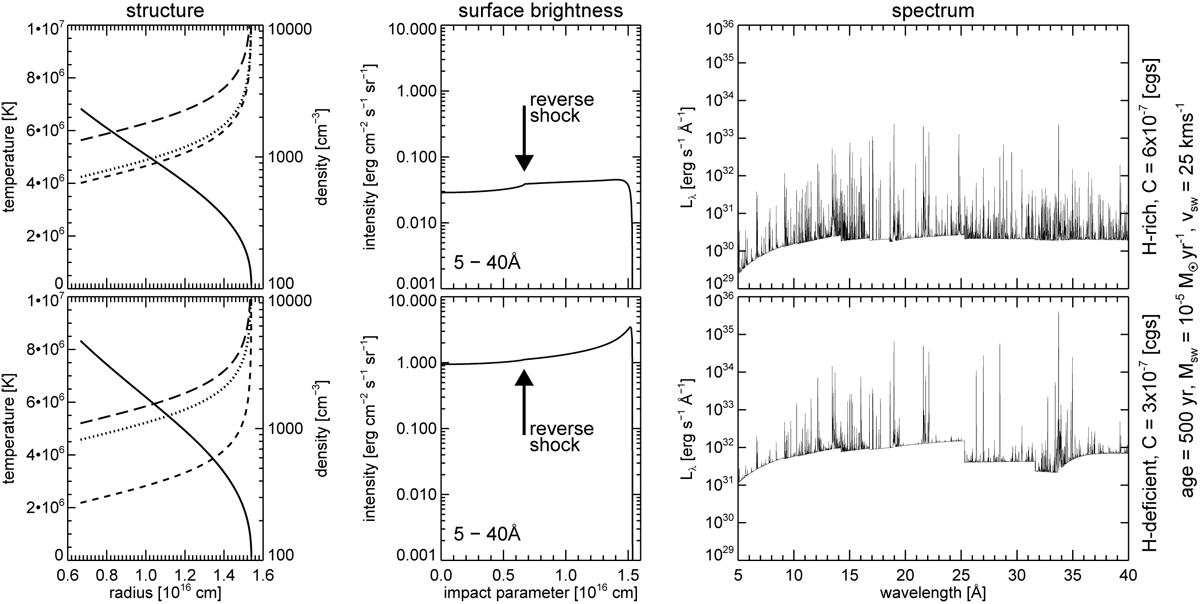
Examples of bubble structures (left panels) and X-ray emissions (middle and right panels) for hydrogen-rich (PN, top panels) and hydrogen-poor (WR, bottom panels) composition. The inner boundaries are at the position of the reverse wind shock (0.67 × 1016 cm), the outer boundaries at the (heat) conduction front at 1.54 × 1016 cm. The planetary nebula proper is on the right side of this front. Both HBs have a similar parameterisation: age = 500 yr, Ṁ sw = 10−5 M⊙ yr−1, vsw = 25 km s−1 , but C = 6 × 10⁻⁷(top panels) and C = 3 × 10⁻⁷ erg cm−1 s−1 K−7∕2 (bottom panels). The bubble structures are characterised by the radial runs of electron temperature (solid), total particle number density (long dashed), ion number density (dashed), and electron density (dotted). We note the linear scale for the temperature, but the logarithmic scale for the densities. The characteristic X-ray temperatures of the bubbles are 2.9 MK (PN) and 2.4 MK (WR), respectively. The intrinsic X-ray surface brightnesses of these two bubble models are displayed in the middle panels and correspond to the emission (spectral luminosity density) in wavelength bands of 5–40 Å (0.3– 2.5 keV) shown in the right panels. The positions of the respective wind reverse shocks (= inner bubble boundaries) are indicated by the arrows. The X-ray luminosities in the given wavelength band are 3.7 × 1032 erg s−1 (PN) and 1.5 × 1034 erg s−1 (WR).
Current usage metrics show cumulative count of Article Views (full-text article views including HTML views, PDF and ePub downloads, according to the available data) and Abstracts Views on Vision4Press platform.
Data correspond to usage on the plateform after 2015. The current usage metrics is available 48-96 hours after online publication and is updated daily on week days.
Initial download of the metrics may take a while.