Fig. 16
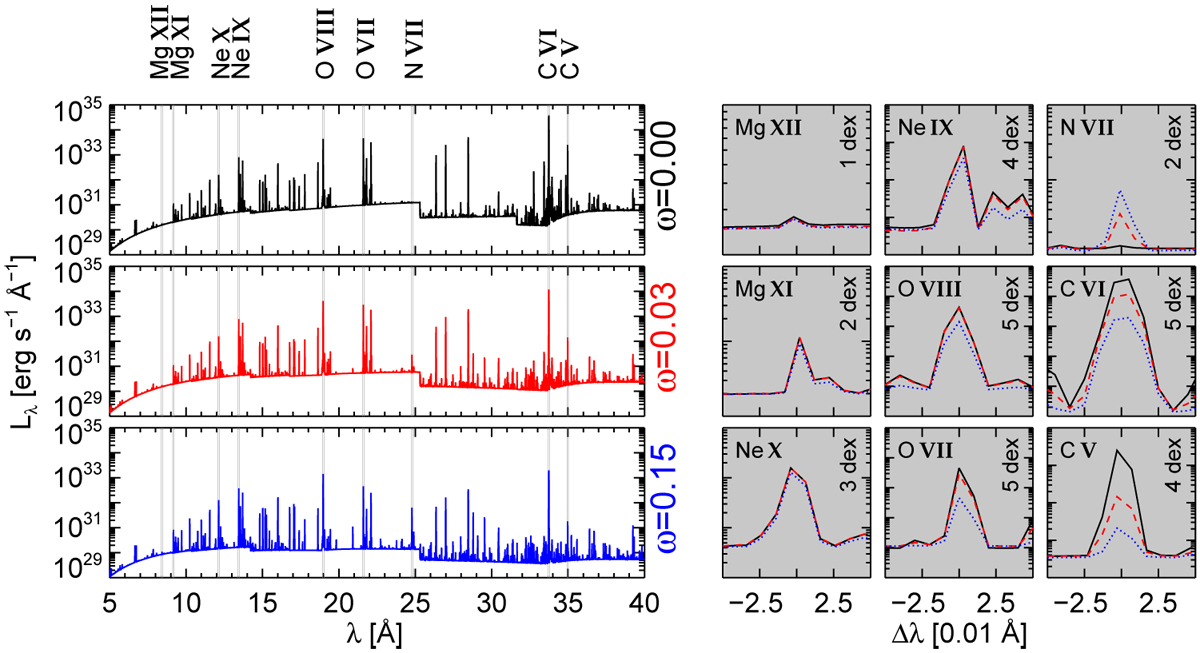
X-ray spectral luminosity (left panels) and selected lines zoomed-in (right panels) of ZP96 bubbles with homogeneous WR composition (ω = 0.00, solid/black) and inhomogeneous WR + PN composition (ω = 0.03, dashed/red, and 0.15, dotted/blue). All three bubble models have the same dimension and temperature profile, and the one used in the middle-left panel is the model used in Figs. 14 and 15. The line-profile panels (grey) cover the wavelength range of 0.10 Å each (i.e. the Chandra resolution), but the (logarithmic) ordinate range may be diffferent so as to give a better match to the various line strengths. Also, all lines are normalised to a single continuum level to ease comparison.
Current usage metrics show cumulative count of Article Views (full-text article views including HTML views, PDF and ePub downloads, according to the available data) and Abstracts Views on Vision4Press platform.
Data correspond to usage on the plateform after 2015. The current usage metrics is available 48-96 hours after online publication and is updated daily on week days.
Initial download of the metrics may take a while.