Fig. 15
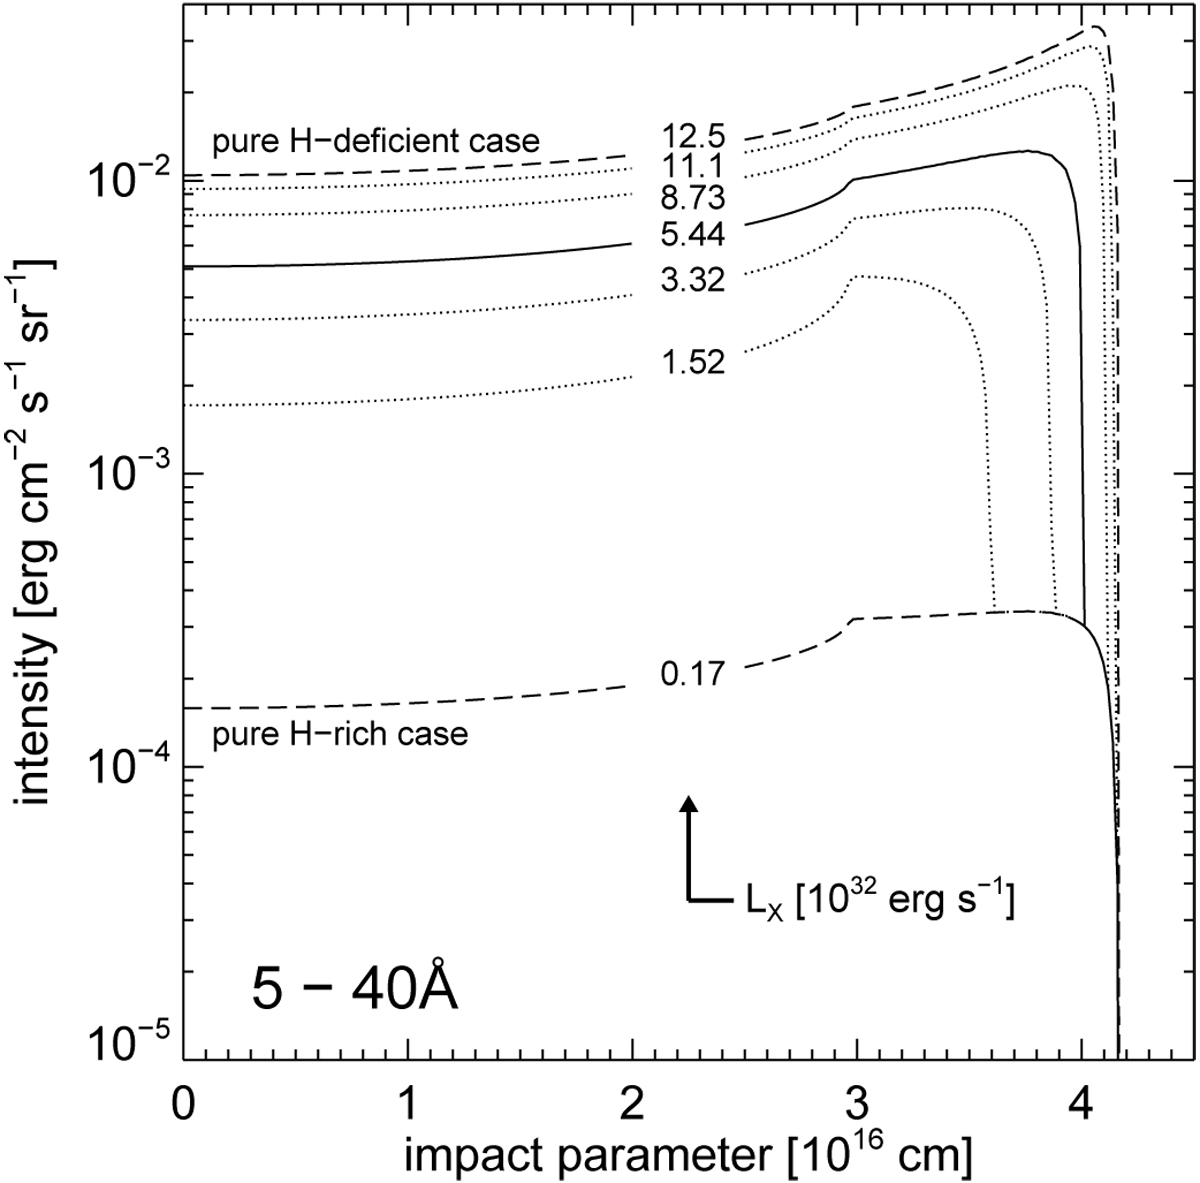
Intrinsic intensity distributions of X-ray emission between 5 and 40 Å for the bubble used in Fig. 14 but with the chemical discontinuity located at different bubble radii, hence with different ω. The individual intensity distributions correspond either to the specific bubble model of Fig. 14 (solid) or to the positions of the chemical discontinuities being at radii indicated by the filled circles in Fig. 14 (dotted), whereas the two chemically homogeneous cases PN and WR are rendered as dashed lines. The model belonging to the open circle in Fig. 14 is not shown because of its similarity to the ω = 0.03 model. The numbers at the curves indicate the X-ray luminosities (in 1032 erg s−1 ) computed for the given wavelength range.
Current usage metrics show cumulative count of Article Views (full-text article views including HTML views, PDF and ePub downloads, according to the available data) and Abstracts Views on Vision4Press platform.
Data correspond to usage on the plateform after 2015. The current usage metrics is available 48-96 hours after online publication and is updated daily on week days.
Initial download of the metrics may take a while.