Fig. 12
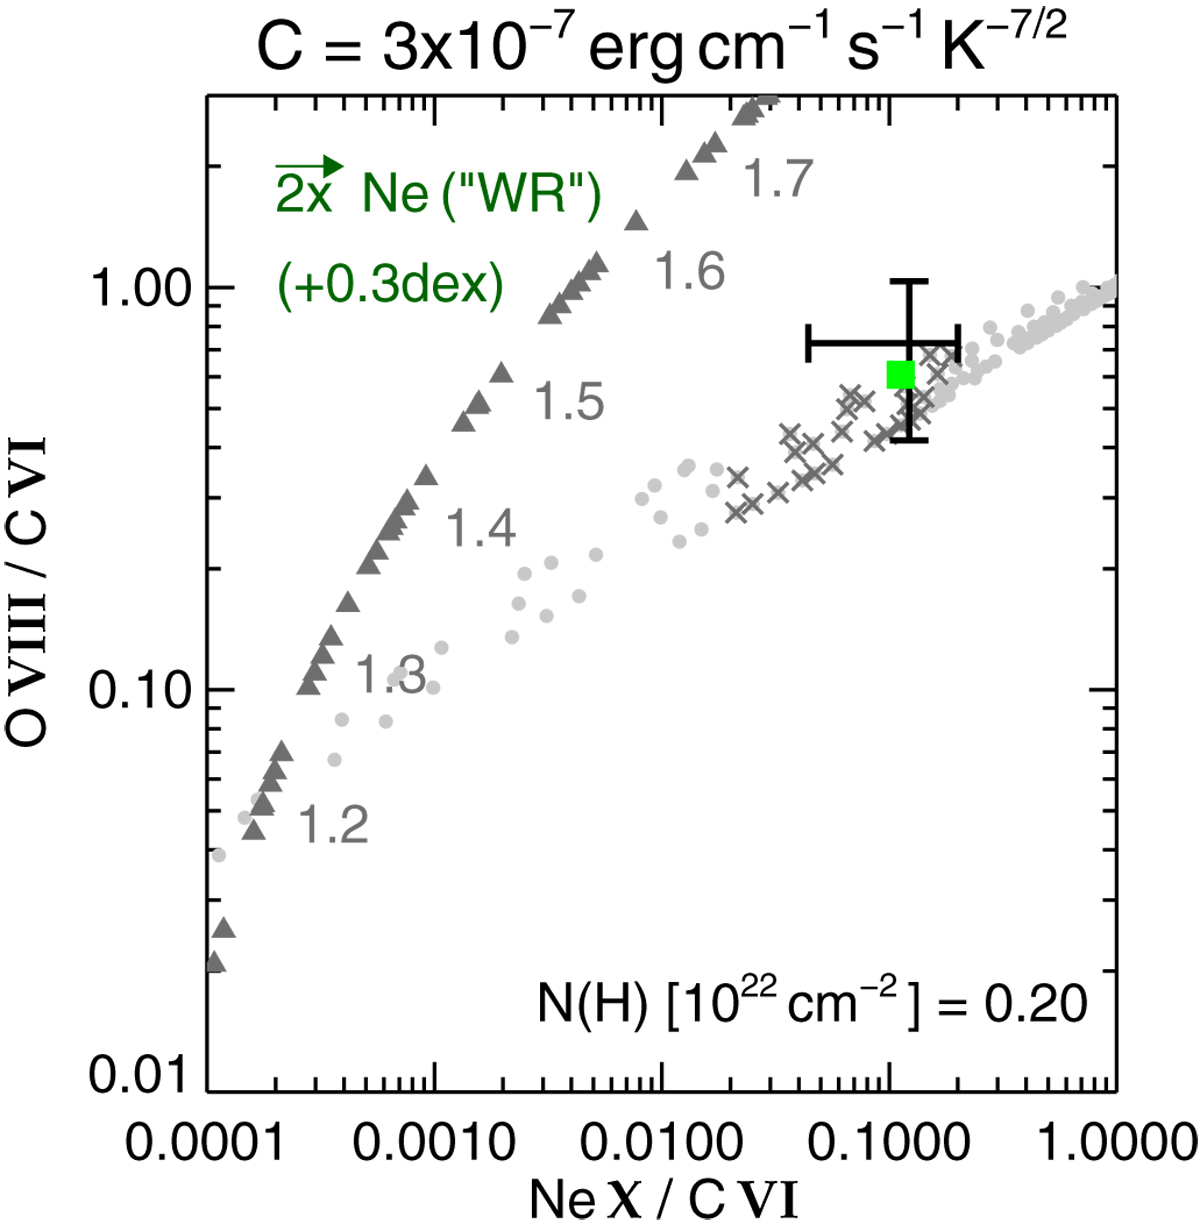
Same as in Fig. 8 but for O VIII/C VI over Ne X/C VI and for NH = 0.20 × 1022 cm−2. The neon abundance from Table 2 (WR) is increased by a factor of two. The horizontal shift of the bubbles from their original positions is indicated by the error in the upper left corner of the plot. The green square marks our “best-fit” bubble (see text). Filled triangles represent our iso-HB models, also shifted accordingly.
Current usage metrics show cumulative count of Article Views (full-text article views including HTML views, PDF and ePub downloads, according to the available data) and Abstracts Views on Vision4Press platform.
Data correspond to usage on the plateform after 2015. The current usage metrics is available 48-96 hours after online publication and is updated daily on week days.
Initial download of the metrics may take a while.