Fig. 10
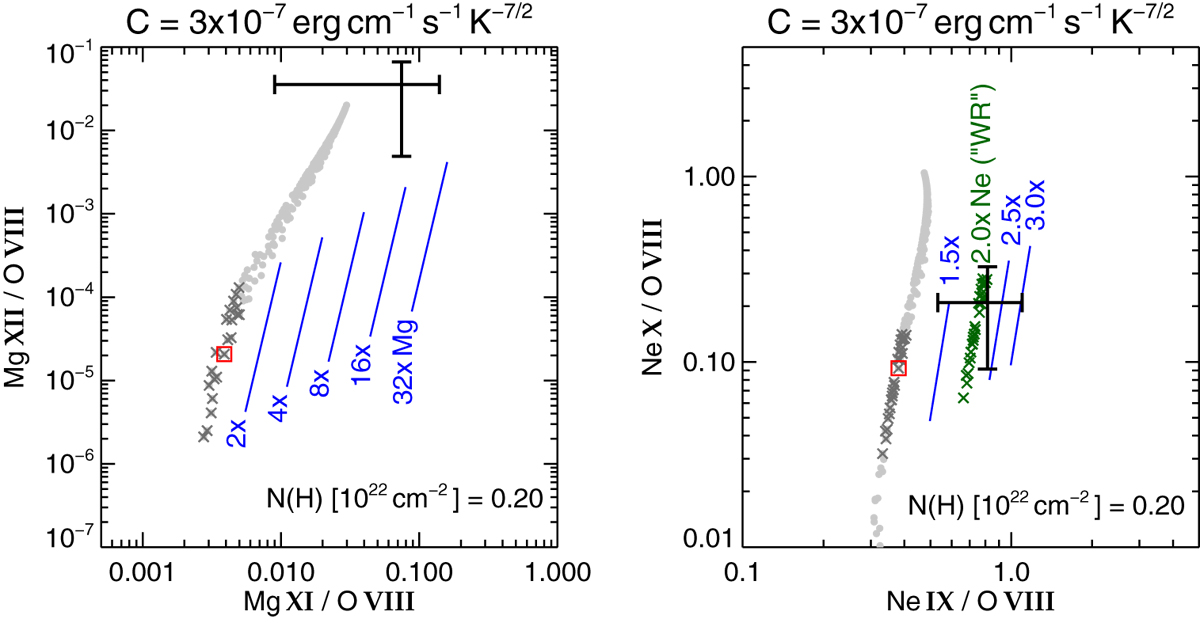
Absorbed line ratios of Mg XII/O VIII over Mg XI/O VIII (left panel) and Ne X/O VIII over Ne IX/O VIII for NH = 0.20 × 1022 cm−2 and the resp- ective observed line ratios for BD +30 (error cross). The symbols have the same meaning as in Fig. 8 (or Fig. 9). The parallel lines indicate the shift of the crossed models (and the “best-fit” model as well) if the original bubble abundances of Mg (left panel) or Ne (right panel) are multiplied by the given factor. The corresponding shifts of the remaining bubble models are not shown in order to avoid confusion.
Current usage metrics show cumulative count of Article Views (full-text article views including HTML views, PDF and ePub downloads, according to the available data) and Abstracts Views on Vision4Press platform.
Data correspond to usage on the plateform after 2015. The current usage metrics is available 48-96 hours after online publication and is updated daily on week days.
Initial download of the metrics may take a while.