Free Access
Fig. 2
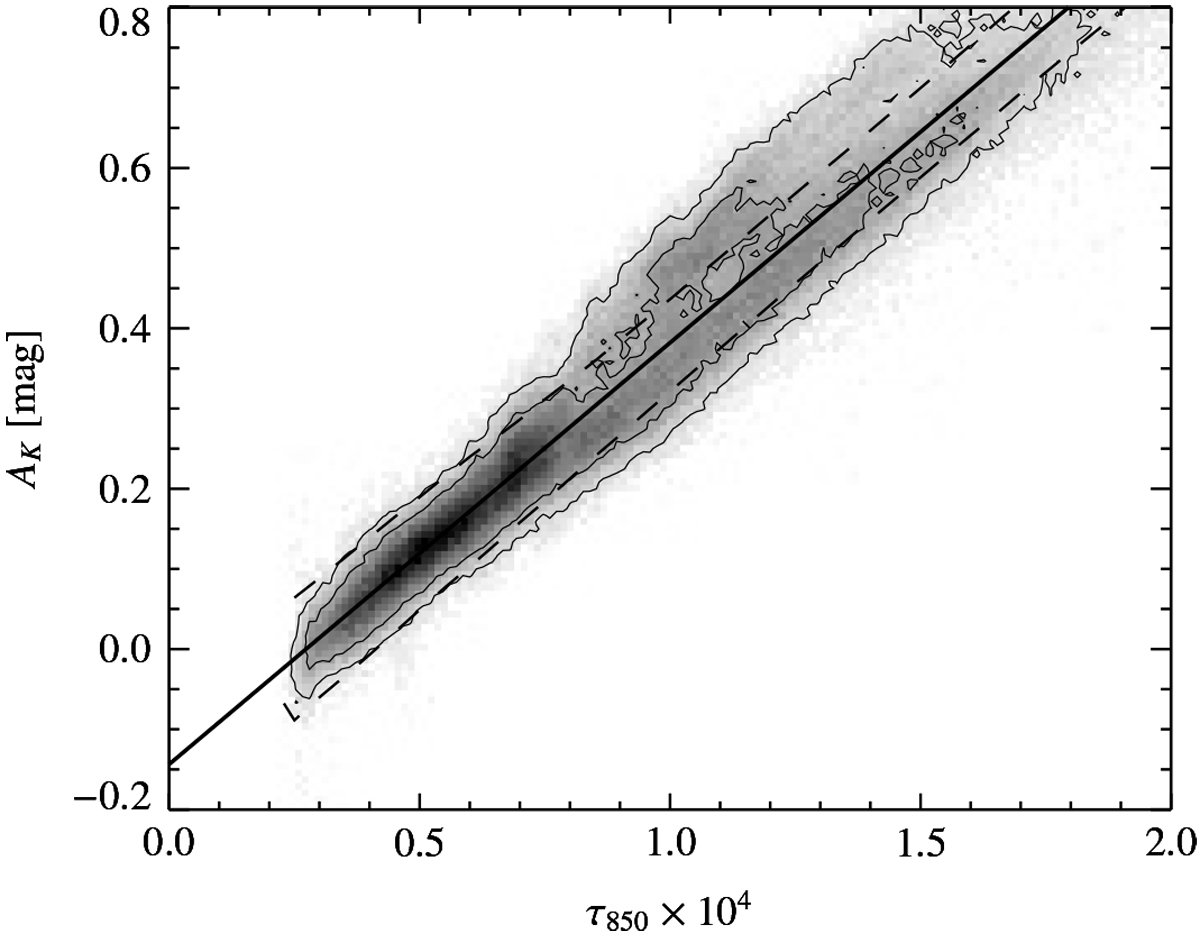
Relation between NIR extinction values AK and optical depth derived from dust emission τ850. The solid line indicates the best-fitting linear function in the τ850 range shown, the dashed line the corresponding 3-σ region. The black contours enclose 68% and 95% of the data points.
Current usage metrics show cumulative count of Article Views (full-text article views including HTML views, PDF and ePub downloads, according to the available data) and Abstracts Views on Vision4Press platform.
Data correspond to usage on the plateform after 2015. The current usage metrics is available 48-96 hours after online publication and is updated daily on week days.
Initial download of the metrics may take a while.