Fig. 18
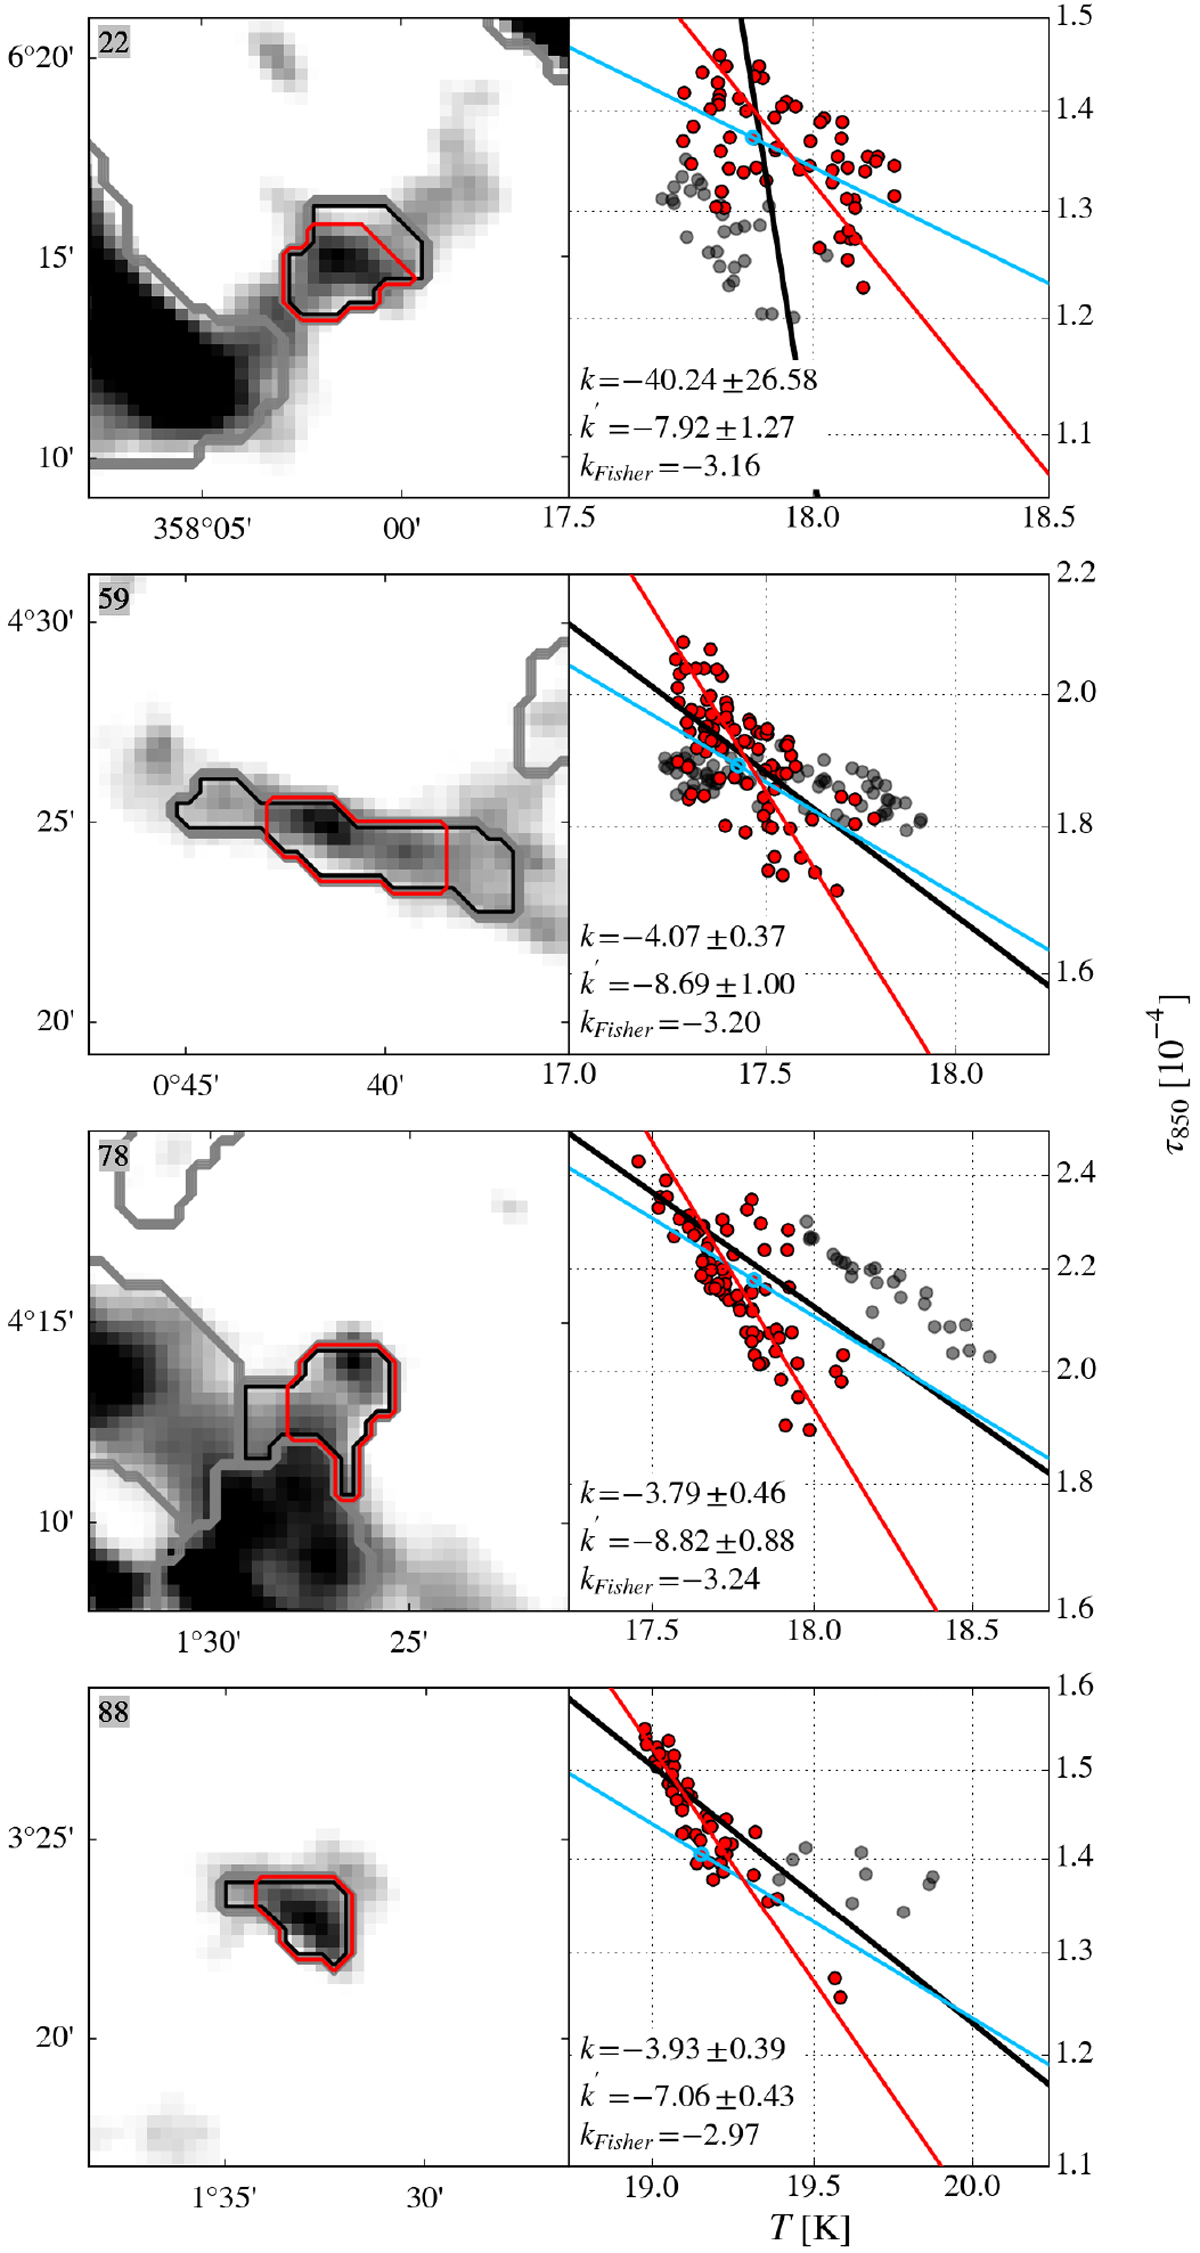
Column density τ850 as a function of effective temperature T for four candidate fakes cores with substructure. Left panels: column-density map with the R09 core indicated by black and the adapted core boundaries by red contours. The R09 core number is given in the top left corner. Other R09 cores in the field are indicated by grey contours. To highlight substructures within the cores, the colour scale’s upper and lower limits are set to the minimum and maximum τ850 value in the core. Right panels: same colour coding as Fig. 13. Data points within the adapted boundaries are shown as red circles, and the corresponding power-law fit with the slope k′ as a red line.
Current usage metrics show cumulative count of Article Views (full-text article views including HTML views, PDF and ePub downloads, according to the available data) and Abstracts Views on Vision4Press platform.
Data correspond to usage on the plateform after 2015. The current usage metrics is available 48-96 hours after online publication and is updated daily on week days.
Initial download of the metrics may take a while.