Fig. 17
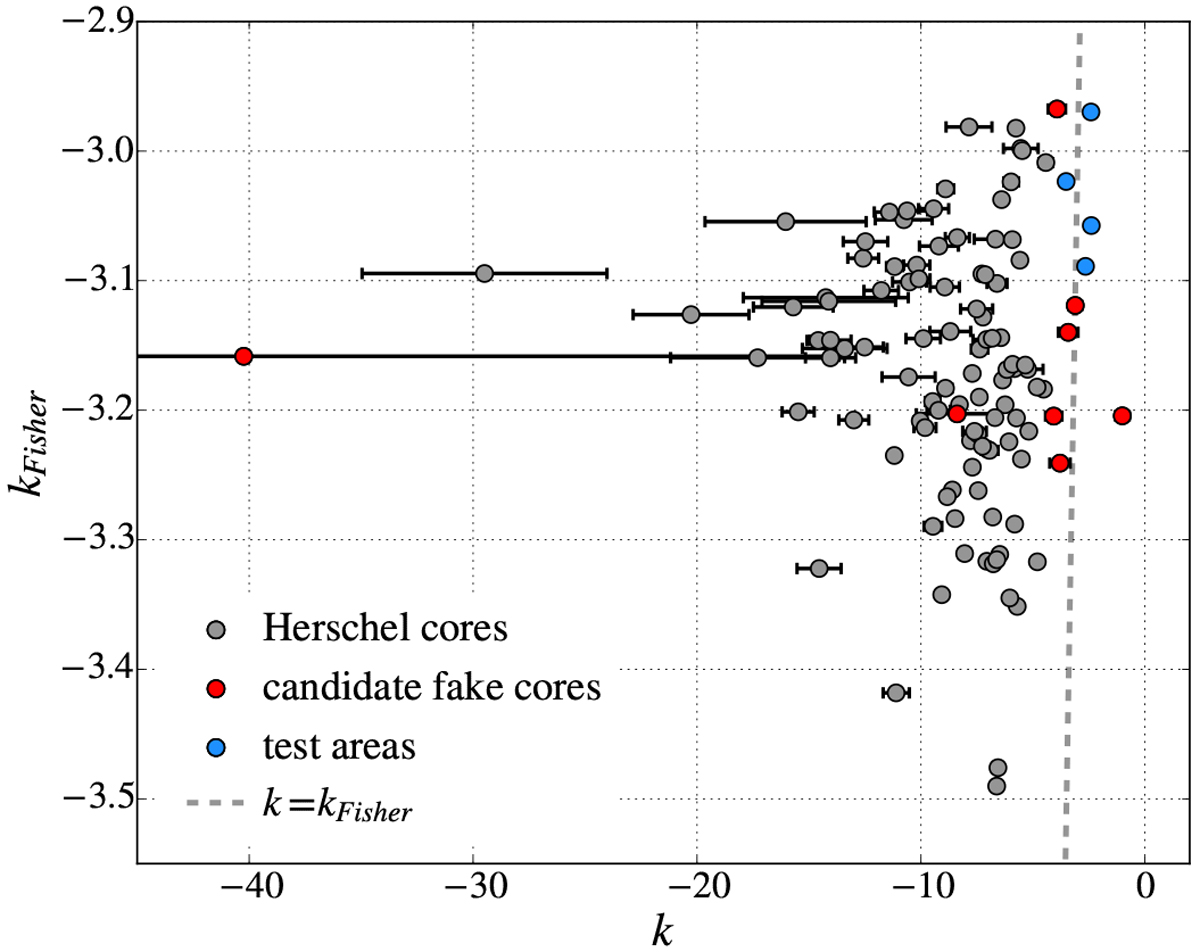
Comparison of slopes derived from a fit to the column-density and effective-temperature data within R09 cores k and derived from the Fisher information matrix kFisher. Grey, red, and blue circles correspond to all R09 cores within the Herschel coverage, the candidate fake cores as a subset of these, and the test areas, respectively. The dashed line indicates equality.
Current usage metrics show cumulative count of Article Views (full-text article views including HTML views, PDF and ePub downloads, according to the available data) and Abstracts Views on Vision4Press platform.
Data correspond to usage on the plateform after 2015. The current usage metrics is available 48-96 hours after online publication and is updated daily on week days.
Initial download of the metrics may take a while.