Fig. 13
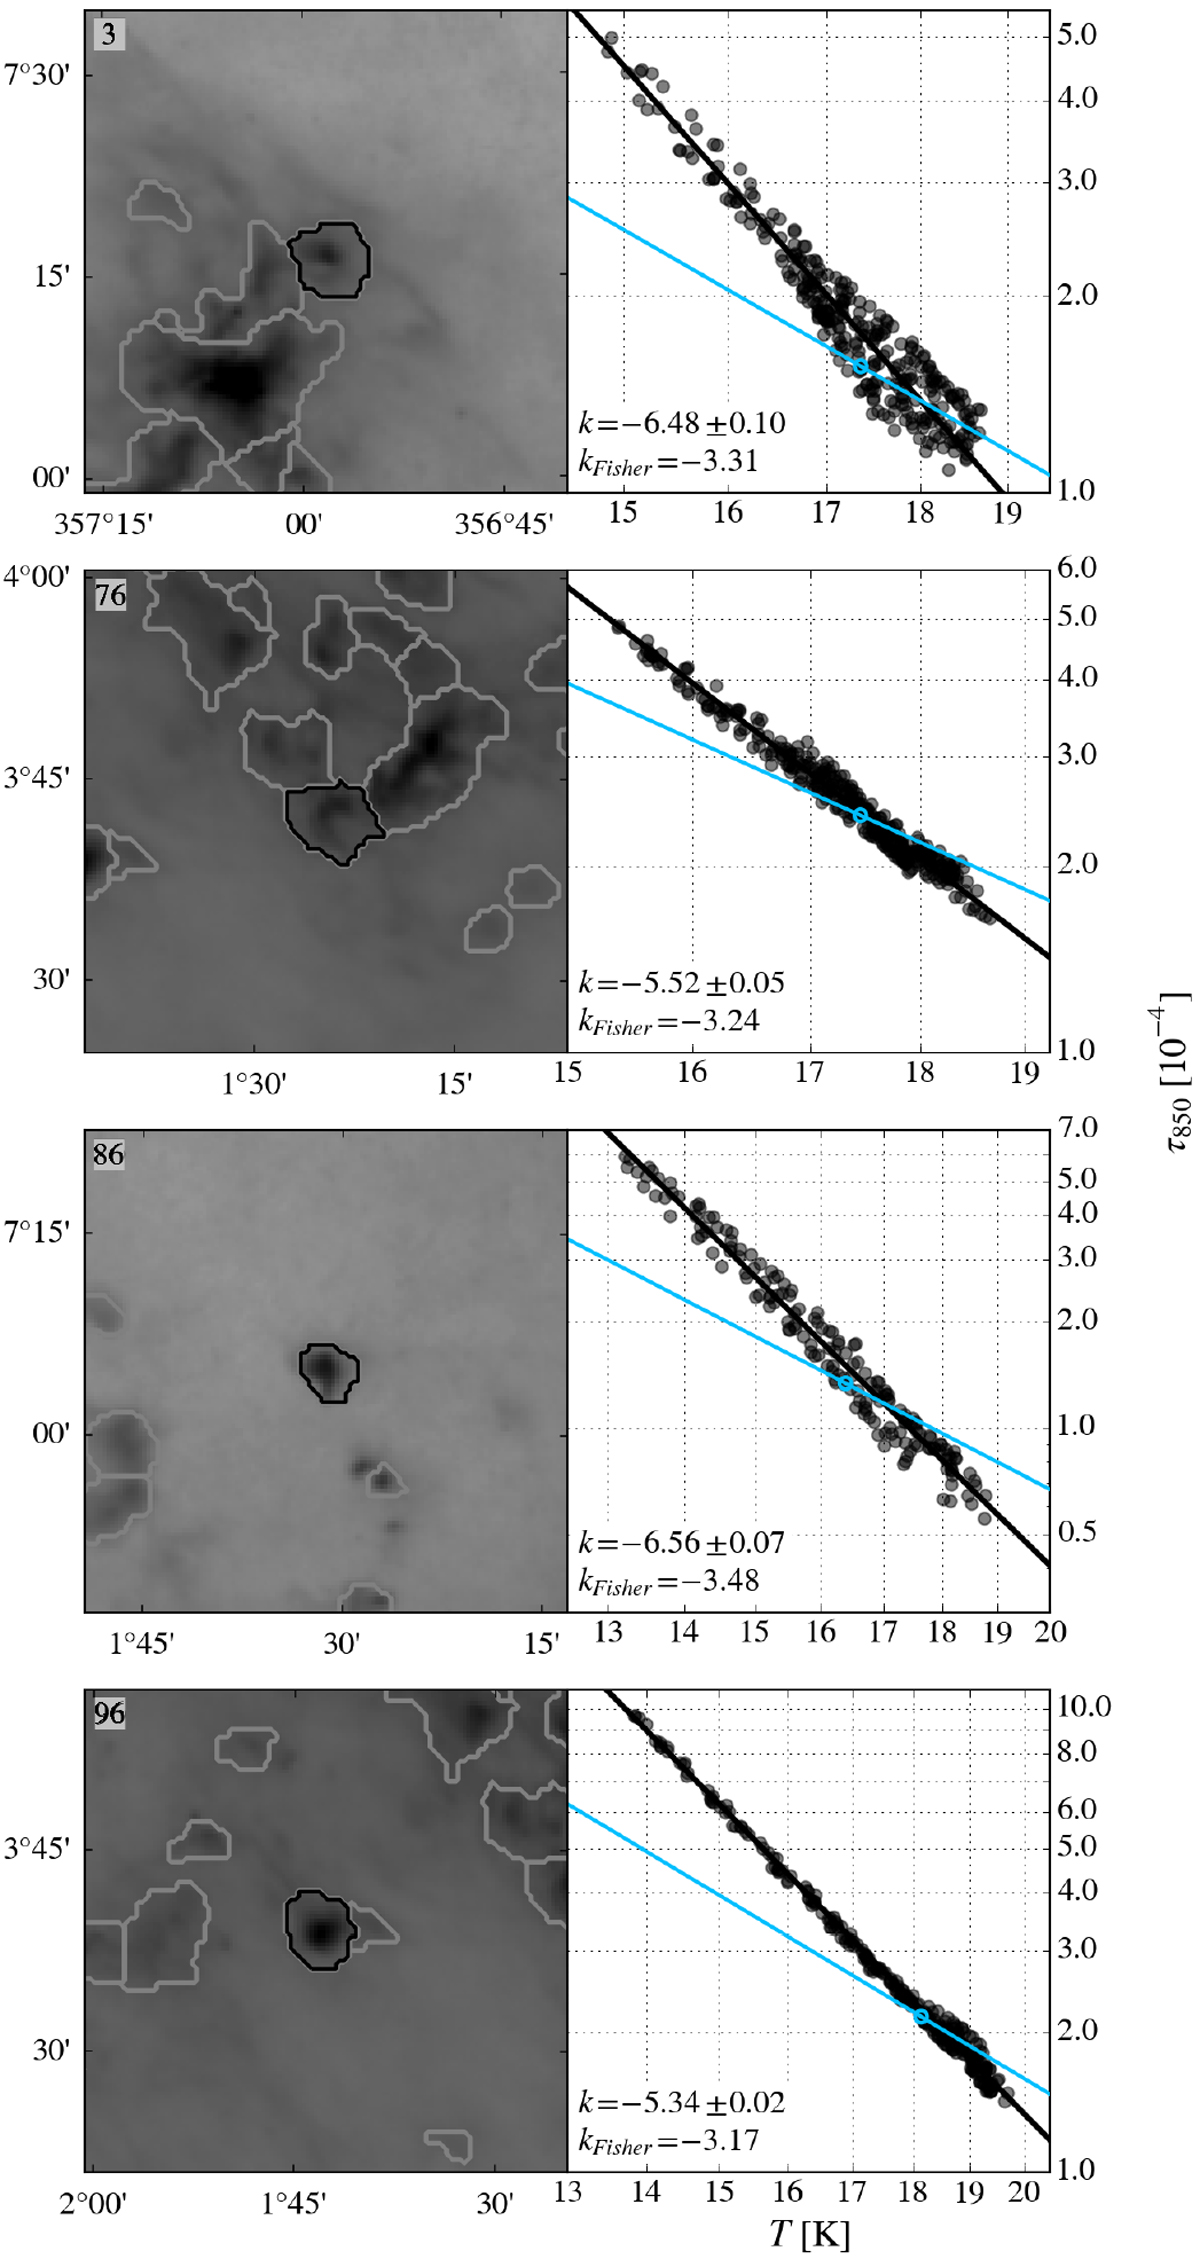
Column density τ850 as a function of effective temperature T for four R09 cores with clear linear relations. Left panels: column-density map with the core indicated by black contours. The R09 core number is given in the top left corner. Other R09 cores in the field are indicated by grey contours. Right panels: each data point corresponds to one pixel in the HP2 maps. The black line is a power-law fit to the data points. The blue line is a power-law function with the exponent kFisher and the normalisation chosen such that the function passes through the reference data point indicated by a blue circle.
Current usage metrics show cumulative count of Article Views (full-text article views including HTML views, PDF and ePub downloads, according to the available data) and Abstracts Views on Vision4Press platform.
Data correspond to usage on the plateform after 2015. The current usage metrics is available 48-96 hours after online publication and is updated daily on week days.
Initial download of the metrics may take a while.