Free Access
Fig. 12
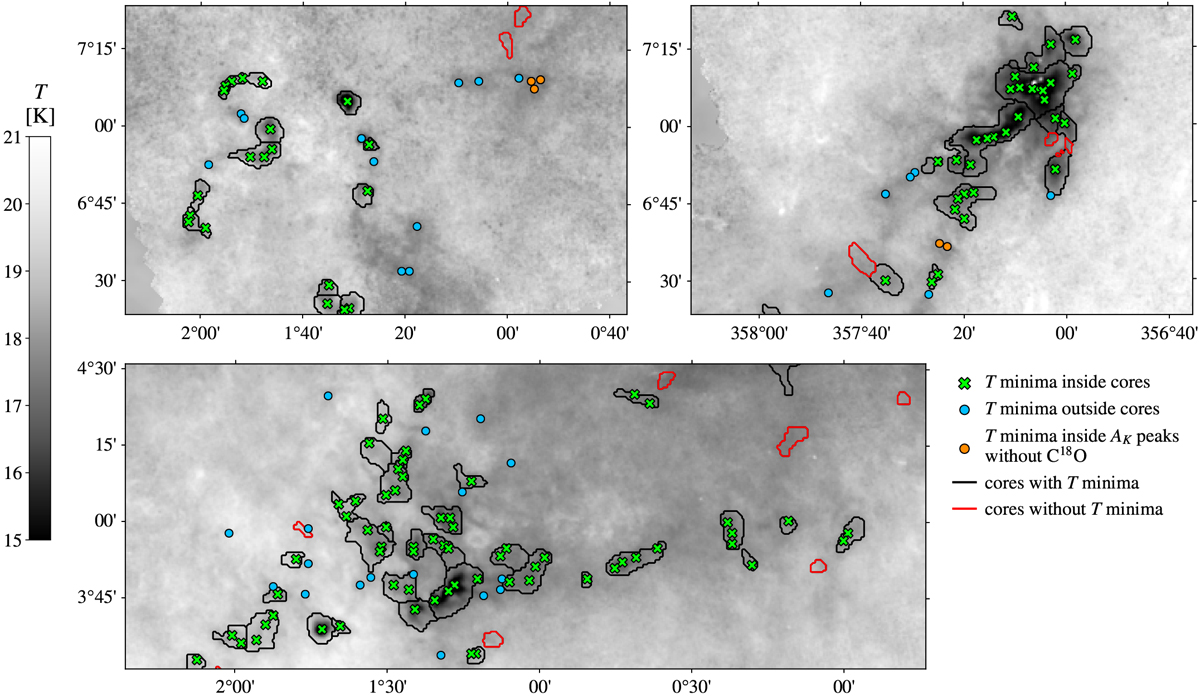
Map of effective dust temperature T for part of the Smoke region (top left panel), part of the Stem region including B59 (top right panel), and part of the Bowl region (bottom panel), with T minima and R09 cores indicated as described in the legend.
Current usage metrics show cumulative count of Article Views (full-text article views including HTML views, PDF and ePub downloads, according to the available data) and Abstracts Views on Vision4Press platform.
Data correspond to usage on the plateform after 2015. The current usage metrics is available 48-96 hours after online publication and is updated daily on week days.
Initial download of the metrics may take a while.