Fig. 3
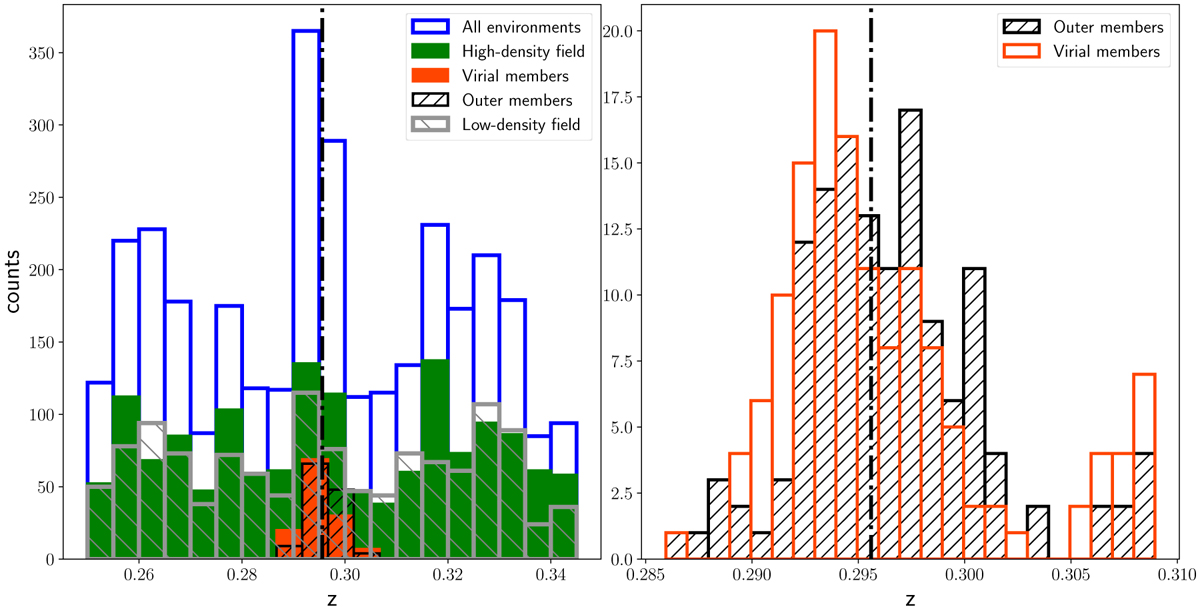
Redshift distribution of the spectrophotometric sample in the region including the XLSSsC N01 supercluster. The centroid redshift of the supercluster is represented with a black dashed line in both panels. Left panel: whole spectroscopic sample (blue histogram), low-density field galaxies (grey distribution), galaxies in the high-density field (green distribution), and galaxies classified as virial and outer members (dark orange and black histogram, respectively). Right panel: zoom in on the virial and outer members, with the same colours used in the left panel (see Sect. 3 for details about the definition of different environments).
Current usage metrics show cumulative count of Article Views (full-text article views including HTML views, PDF and ePub downloads, according to the available data) and Abstracts Views on Vision4Press platform.
Data correspond to usage on the plateform after 2015. The current usage metrics is available 48-96 hours after online publication and is updated daily on week days.
Initial download of the metrics may take a while.