Fig. A.1.
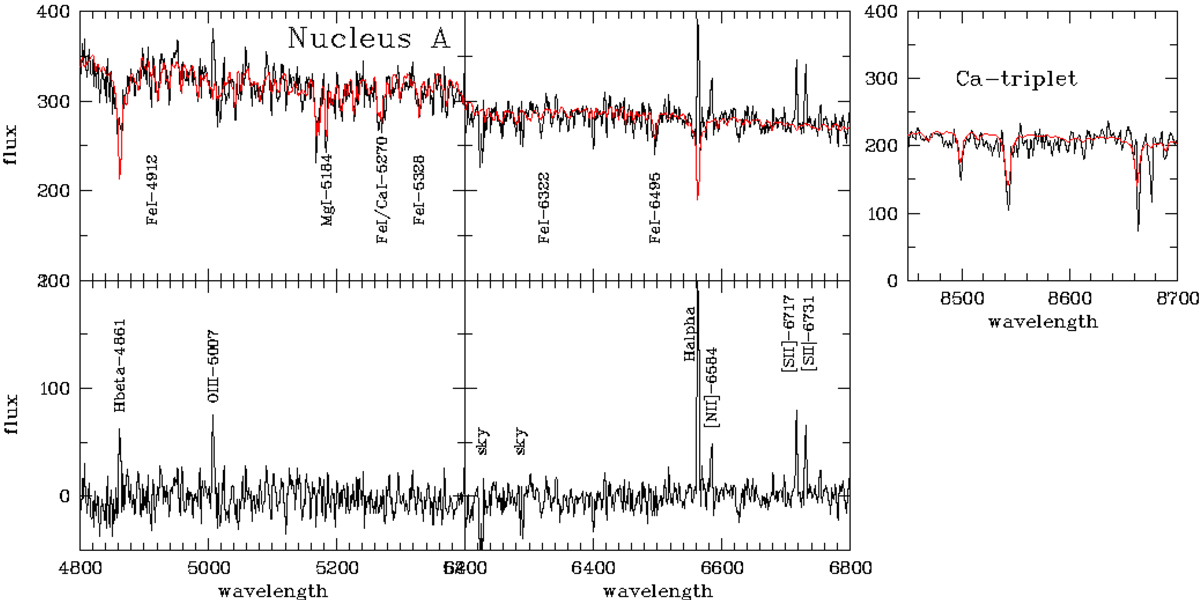
Spectrum of nucleus A (see Sect. 4). We show only the two most interesting wavelength intervals. Some spectral features are marked for orientation. Upper panel: black solid line marks the observed spectrum, the red solid line the model spectrum. The fluxes are given in units of 10−20 erg−1 cm−2 Å. Lower panel: model spectrum has been subtracted. Here the emission lines are local foreground/background and the cluster itself apparently does not host ionised gas. Right panel: spectral region of the Calcium triplet. This near-infrared region is not well fitted. We therefore measure the EWs directly in the spectrum.
Current usage metrics show cumulative count of Article Views (full-text article views including HTML views, PDF and ePub downloads, according to the available data) and Abstracts Views on Vision4Press platform.
Data correspond to usage on the plateform after 2015. The current usage metrics is available 48-96 hours after online publication and is updated daily on week days.
Initial download of the metrics may take a while.