Fig. 4.
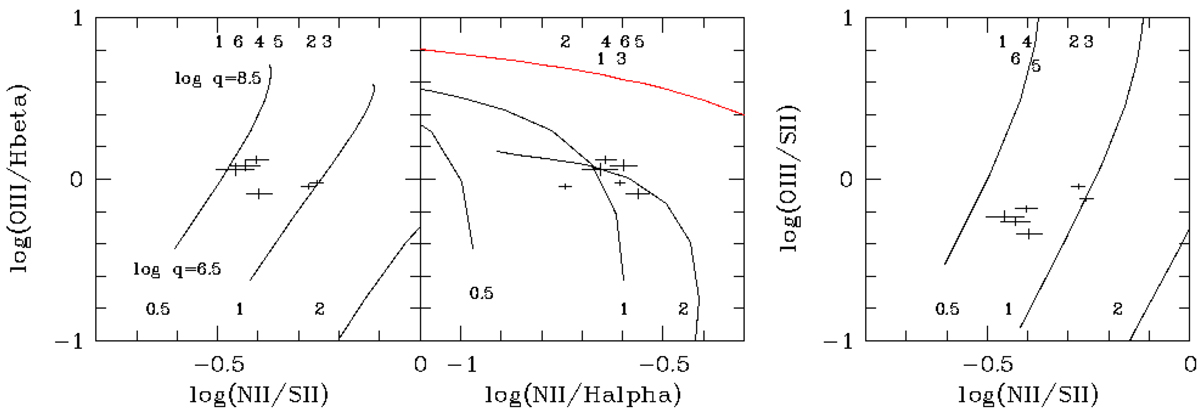
Diagnostic graphs for our six characteristic spectra. These line ratios are compared to HII-region models from Dopita et al. (2013; for a Boltzmann distribution of electrons) with the ionisation parameter log(q) and three oxygen abundances in solar units (0.5, 1, 2) as parameters. The solid lines are lines of constant abundance and varying log(q). The range of log(q) values is indicated in the left panel and is the same for all panels. The solid red line in the middle panel is the line separating HII-regions from AGN-like spectra according to Kewley et al. (2001). The numbers in the upper parts identify the spectra from Table 3 by their sequence. The symbol sizes represent the measurement uncertainty. As noted by Dopita et al. (2013), the right diagnostic graph seems to provide the cleanest separation of log(q) and z. The spectra indicate a solar oxygen abundance for regions B and C and slightly less for the other spectra (Table 4). This abundance variation is not, however, backed up by the empirical calibration of Pilyugin & Grebel (2016).
Current usage metrics show cumulative count of Article Views (full-text article views including HTML views, PDF and ePub downloads, according to the available data) and Abstracts Views on Vision4Press platform.
Data correspond to usage on the plateform after 2015. The current usage metrics is available 48-96 hours after online publication and is updated daily on week days.
Initial download of the metrics may take a while.