Fig. 3.
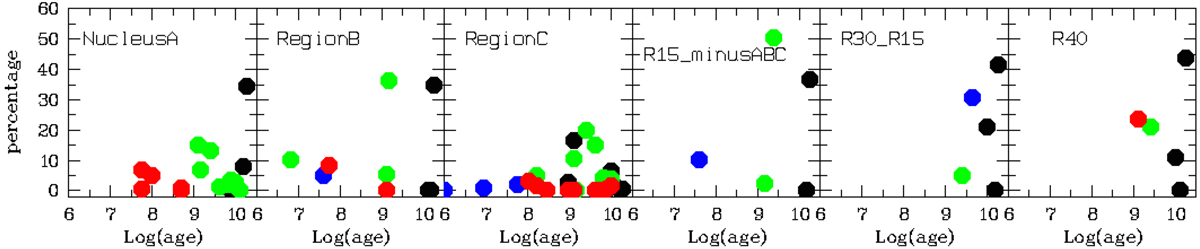
Typical results of a STARLIGHT decomposition for our characteristic spectra. Indicated is the population composition in percentage of light at 5650 Å of all populations involved in the fit. The colours denote metallicities. Black: z = 0.0004; blue: z = 0.008, green: z = 0.02, red: z = 0.05. The individual uncertainties, particularly those at low percentage values, are probably high and determined by many systematics. Therefore this must not be confused with a determination of the star formation history. Rather it confirms what has been suggested by broad-band photometry. Further discussion of this can be found in the text.
Current usage metrics show cumulative count of Article Views (full-text article views including HTML views, PDF and ePub downloads, according to the available data) and Abstracts Views on Vision4Press platform.
Data correspond to usage on the plateform after 2015. The current usage metrics is available 48-96 hours after online publication and is updated daily on week days.
Initial download of the metrics may take a while.