Fig. 2.
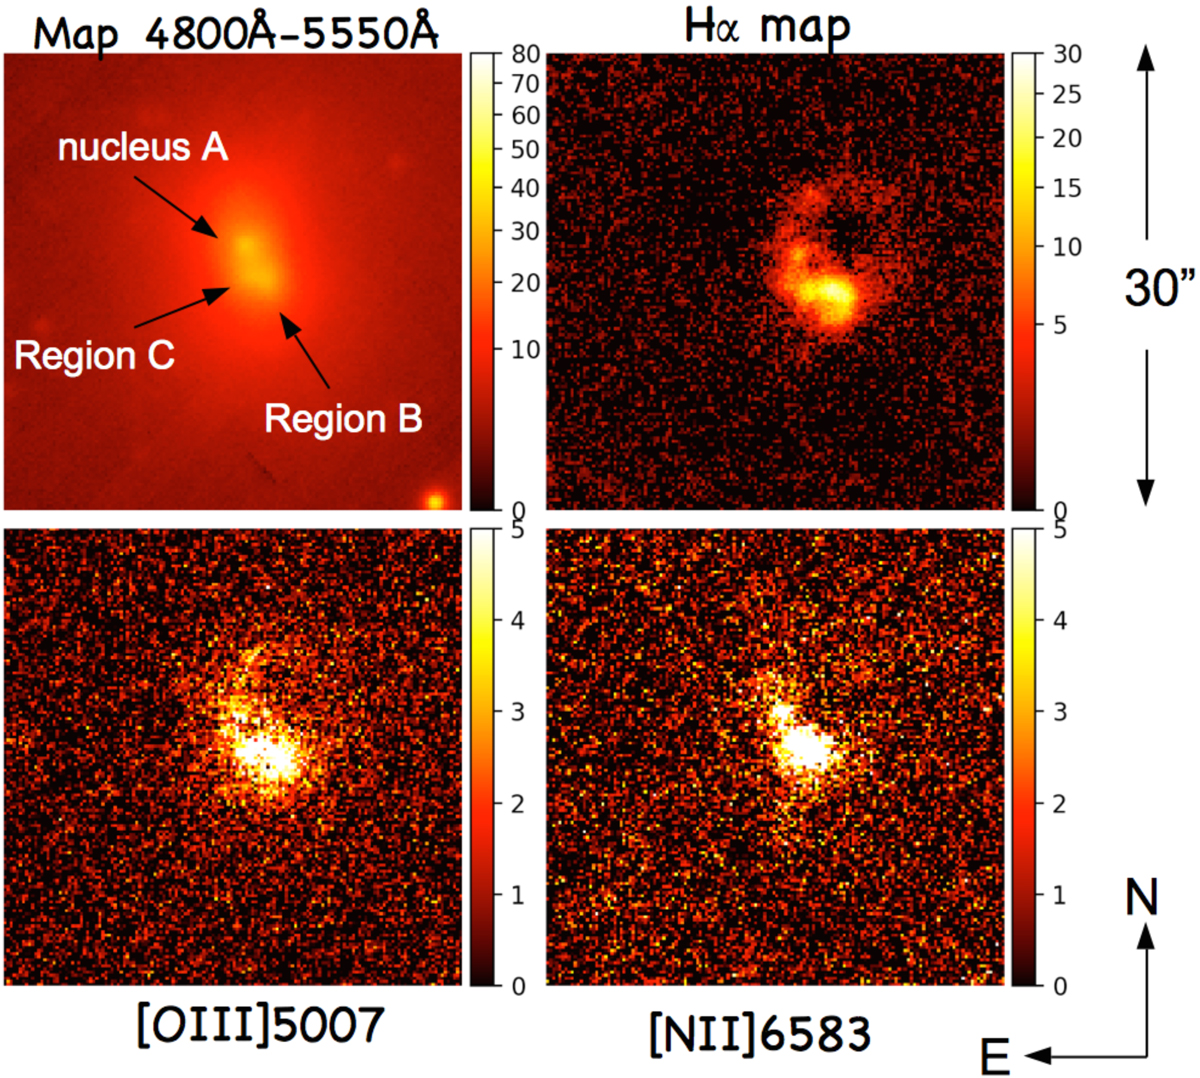
Upper left panel: a MUSE image of NGC 7796-DW1 showing the three different nuclear regions with a square root scaling. Indicated is the mean flux in the interval 4800 Å–5550 Å. As in the other maps, the unit is 10−20 erg s−1 cm−2 Å. Upper right panel: a map of the Hα-flux. The Hα-emission defines an almost complete, but distorted ring with some swellings and knots. Lower left panel: [OIII]5007 map. The [OIII]5007/Hα ratio is constant which indicates local ionising sources. Lower right panel: [NII]6583-map.
Current usage metrics show cumulative count of Article Views (full-text article views including HTML views, PDF and ePub downloads, according to the available data) and Abstracts Views on Vision4Press platform.
Data correspond to usage on the plateform after 2015. The current usage metrics is available 48-96 hours after online publication and is updated daily on week days.
Initial download of the metrics may take a while.