Free Access
Fig. B.4
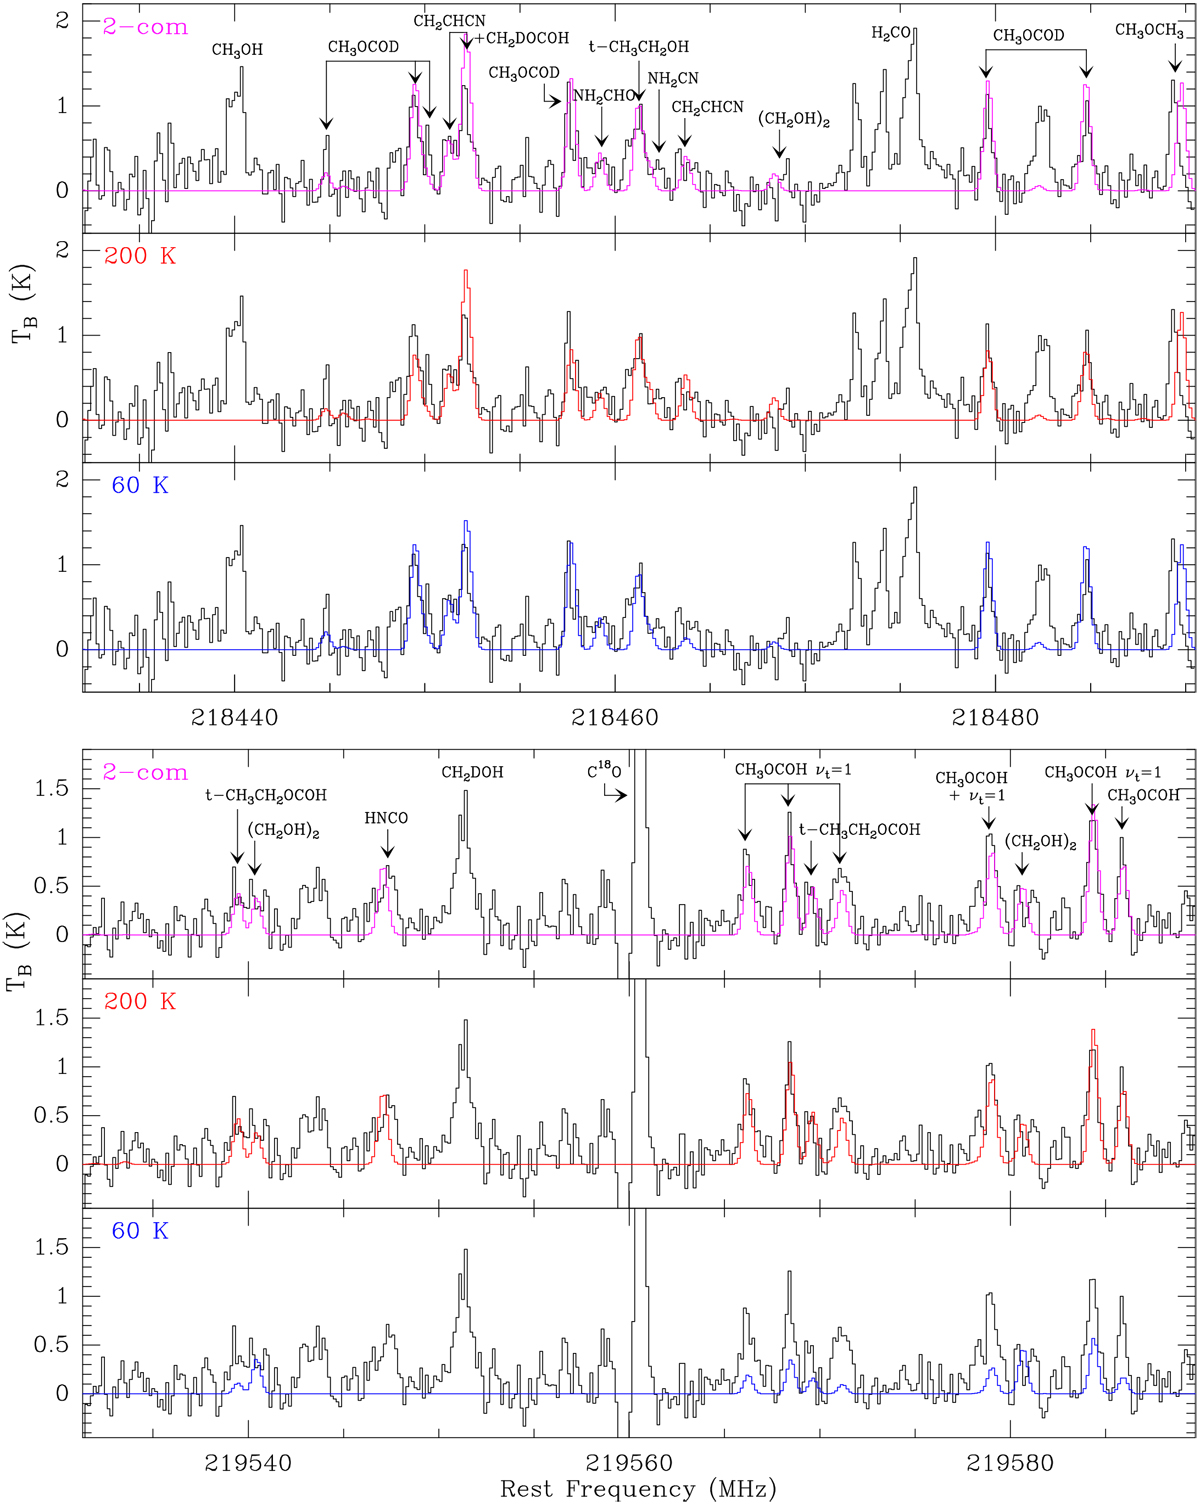
Best LTE models using only one source component for two spectral windows. Middle panels for each frequency range show the results for the 200 K model in red, while bottom panels show in blue the 60 K model. Top panels in purple show the final two-component model.
Current usage metrics show cumulative count of Article Views (full-text article views including HTML views, PDF and ePub downloads, according to the available data) and Abstracts Views on Vision4Press platform.
Data correspond to usage on the plateform after 2015. The current usage metrics is available 48-96 hours after online publication and is updated daily on week days.
Initial download of the metrics may take a while.