Fig. 1
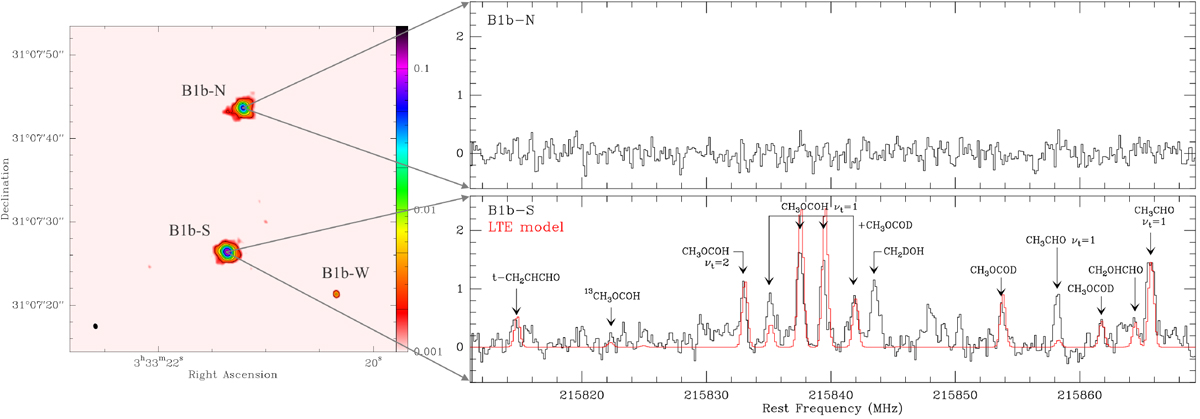
Left panel: Continuum image at 232 GHz (1.290 mm). The colour scale ranges from 0.001 to 0.2 Jy beam−1. The contour levels are indicated on the colour bar. The ALMA beam is plotted on the lower left corner. Right panel: Observed spectra between 215 810 and 215 870 MHz, towards B1b-N (top panel) and B1b-S (bottom panel). Brightness temperaturescale, in K, is given on the left. Line features with no labels are unidentified lines. The LTE simulations are over-plotted in red for B1b-S.
Current usage metrics show cumulative count of Article Views (full-text article views including HTML views, PDF and ePub downloads, according to the available data) and Abstracts Views on Vision4Press platform.
Data correspond to usage on the plateform after 2015. The current usage metrics is available 48-96 hours after online publication and is updated daily on week days.
Initial download of the metrics may take a while.