Fig. 9
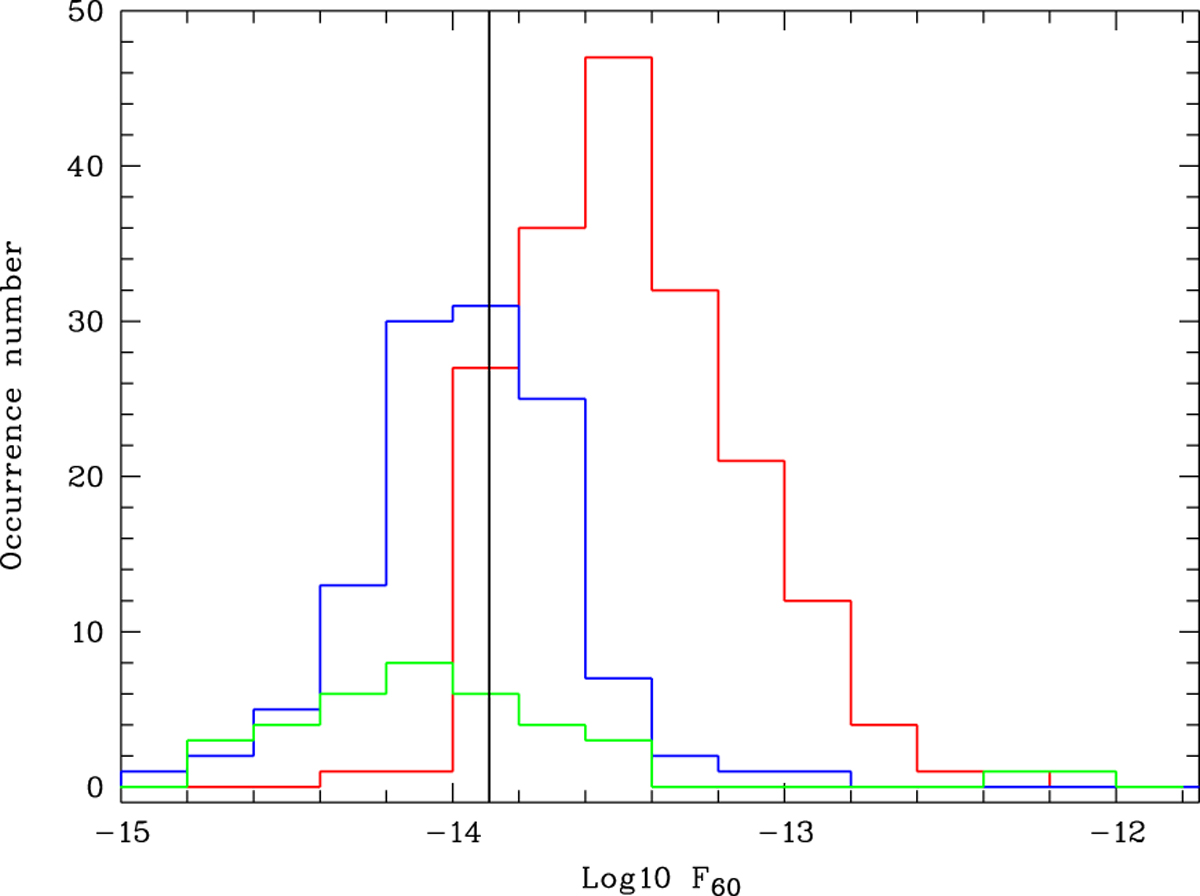
X-ray flux (F60 in log unit of erg s−1 cm−2, within a 60″ radius in the [0.5–2] keV band) distribution for the clusters having a spectroscopic redshift. Red histogram: the C1 sample; blue histogram: the C2 sample; green histogram: the C3 sample. The black vertical line is the estimated reference flux completeness limit of 1.3 × 10⁻¹⁴ erg s−1 cm−2.
Current usage metrics show cumulative count of Article Views (full-text article views including HTML views, PDF and ePub downloads, according to the available data) and Abstracts Views on Vision4Press platform.
Data correspond to usage on the plateform after 2015. The current usage metrics is available 48-96 hours after online publication and is updated daily on week days.
Initial download of the metrics may take a while.