Fig. 7
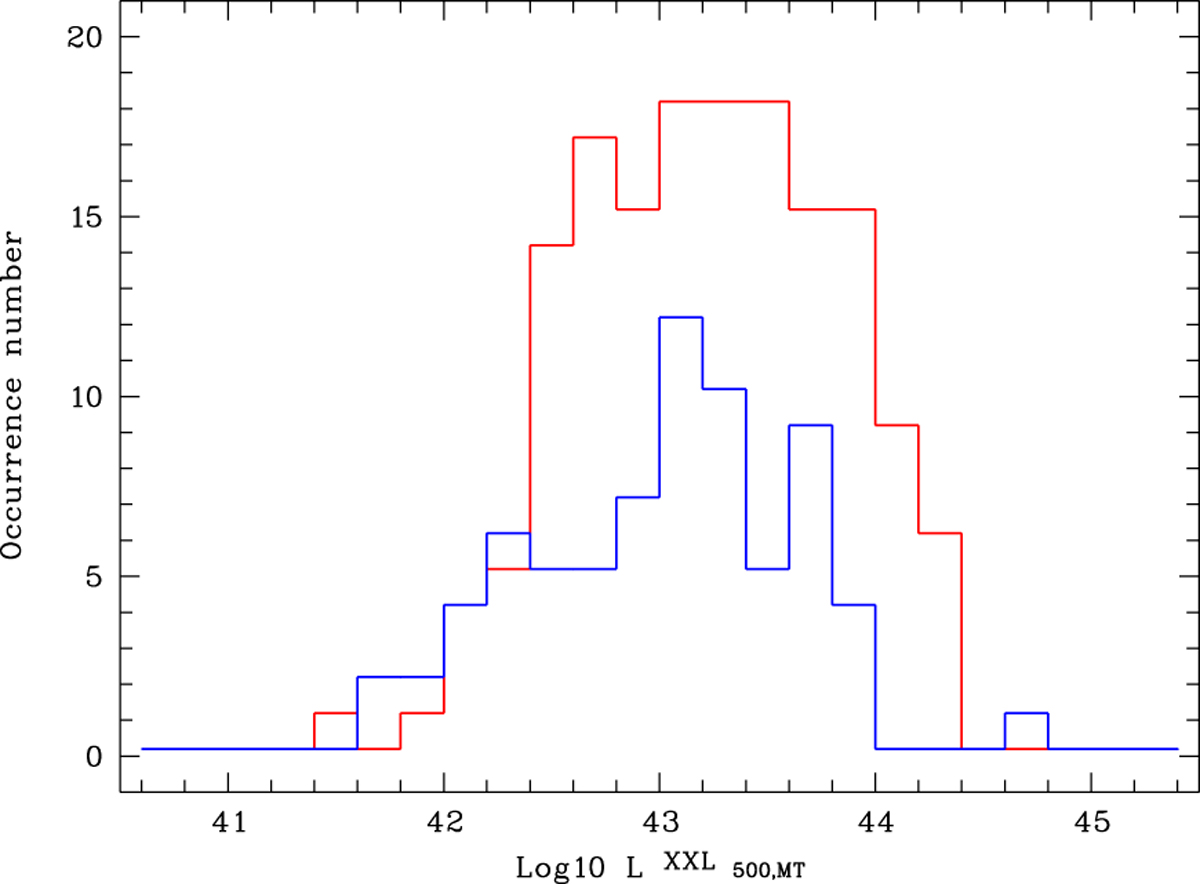
X-ray luminosity (![]() in log unit of erg s−1
in the [0.5–2] keV band) distribution of clusters having a spectroscopic redshift and a luminosity determination. Red histogram: the C1 sample; blue histogram: the C2 sample.
in log unit of erg s−1
in the [0.5–2] keV band) distribution of clusters having a spectroscopic redshift and a luminosity determination. Red histogram: the C1 sample; blue histogram: the C2 sample.
Current usage metrics show cumulative count of Article Views (full-text article views including HTML views, PDF and ePub downloads, according to the available data) and Abstracts Views on Vision4Press platform.
Data correspond to usage on the plateform after 2015. The current usage metrics is available 48-96 hours after online publication and is updated daily on week days.
Initial download of the metrics may take a while.