Fig. 6
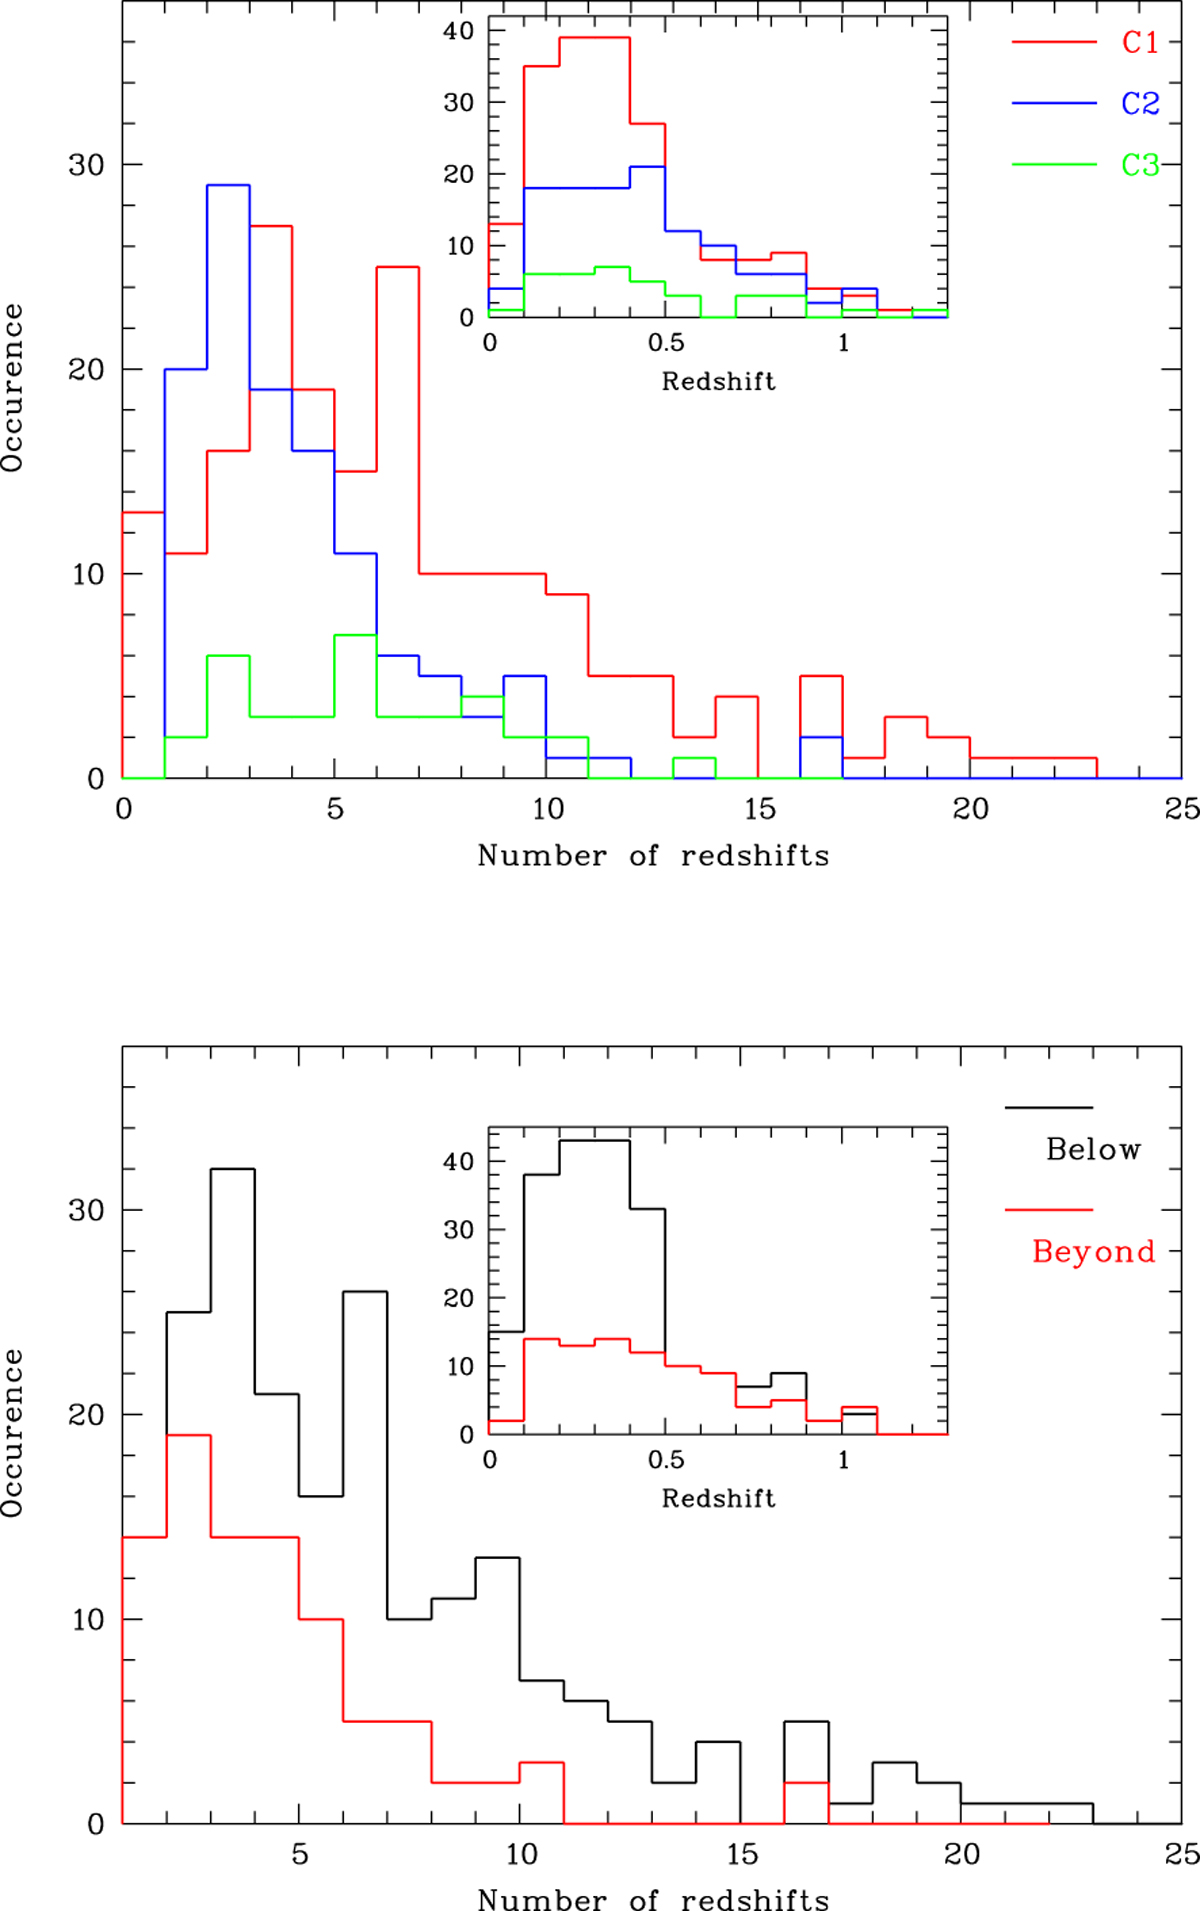
Distribution of the number of spectroscopic redshifts inside clusters with a redshift estimate. The insets show the redshift histograms of these samples. Top panel: C1 (red histograms), C2 (blue histograms), and C3 (green histograms) clusters. Bottom panel: clusters with also a flux estimate fainter (black histograms) and brighter (red histograms) than the reference flux completeness limit of 1.3 × 10⁻¹⁴ erg s−1 cm−2.
Current usage metrics show cumulative count of Article Views (full-text article views including HTML views, PDF and ePub downloads, according to the available data) and Abstracts Views on Vision4Press platform.
Data correspond to usage on the plateform after 2015. The current usage metrics is available 48-96 hours after online publication and is updated daily on week days.
Initial download of the metrics may take a while.