Fig. 3
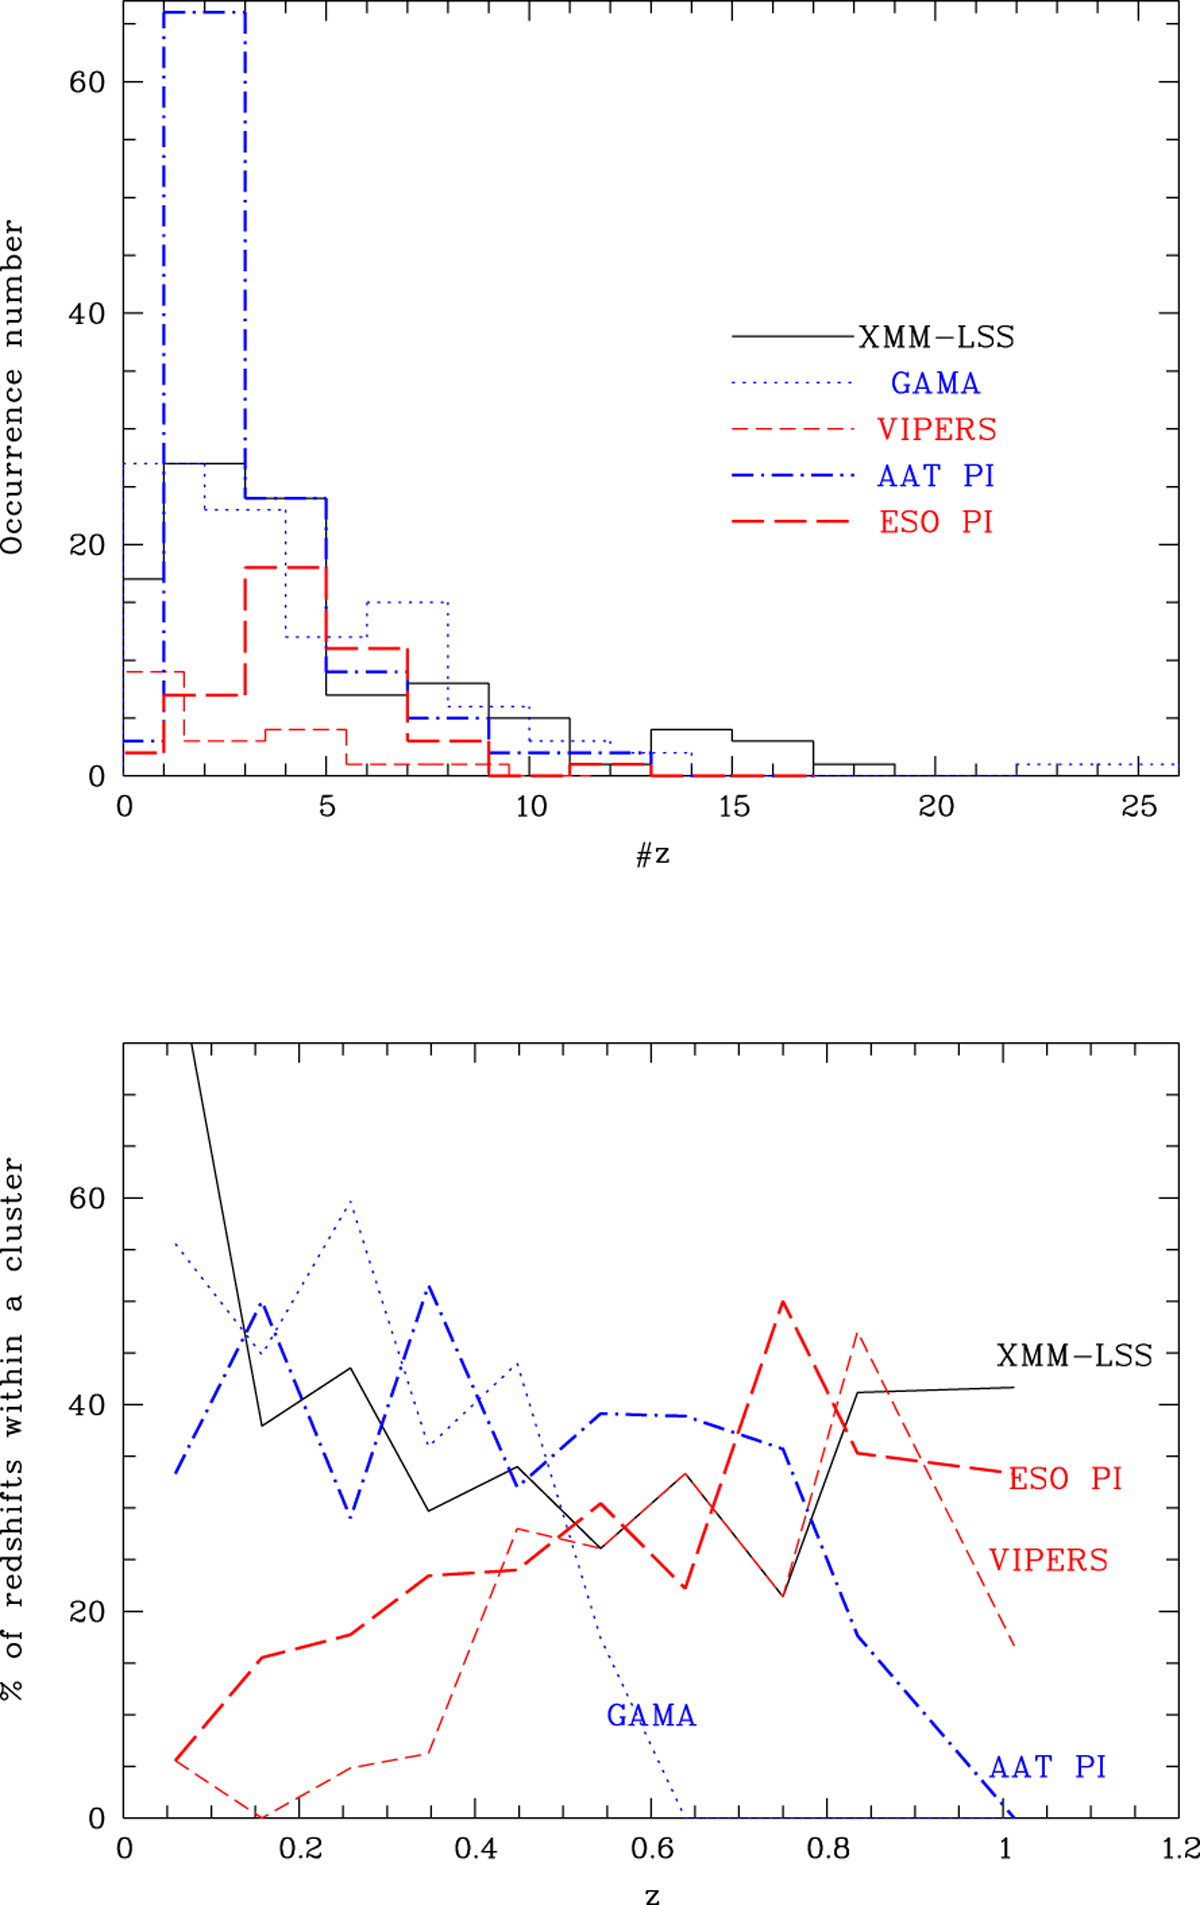
Upper panel: y-axis, number of confirmed clusters; x-axis, number of galaxy redshifts sampling the confirmed clusters. Different colours and line styles are from different spectroscopic surveys. Bottom panel: percentage of galaxy redshifts inside the confirmed clusters coming from a given survey and for a given redshift bin. Because of multiple galaxy spectroscopic measurements, the sum of the percentages for a given redshift bin is larger than 100%.
Current usage metrics show cumulative count of Article Views (full-text article views including HTML views, PDF and ePub downloads, according to the available data) and Abstracts Views on Vision4Press platform.
Data correspond to usage on the plateform after 2015. The current usage metrics is available 48-96 hours after online publication and is updated daily on week days.
Initial download of the metrics may take a while.