Fig. D.1
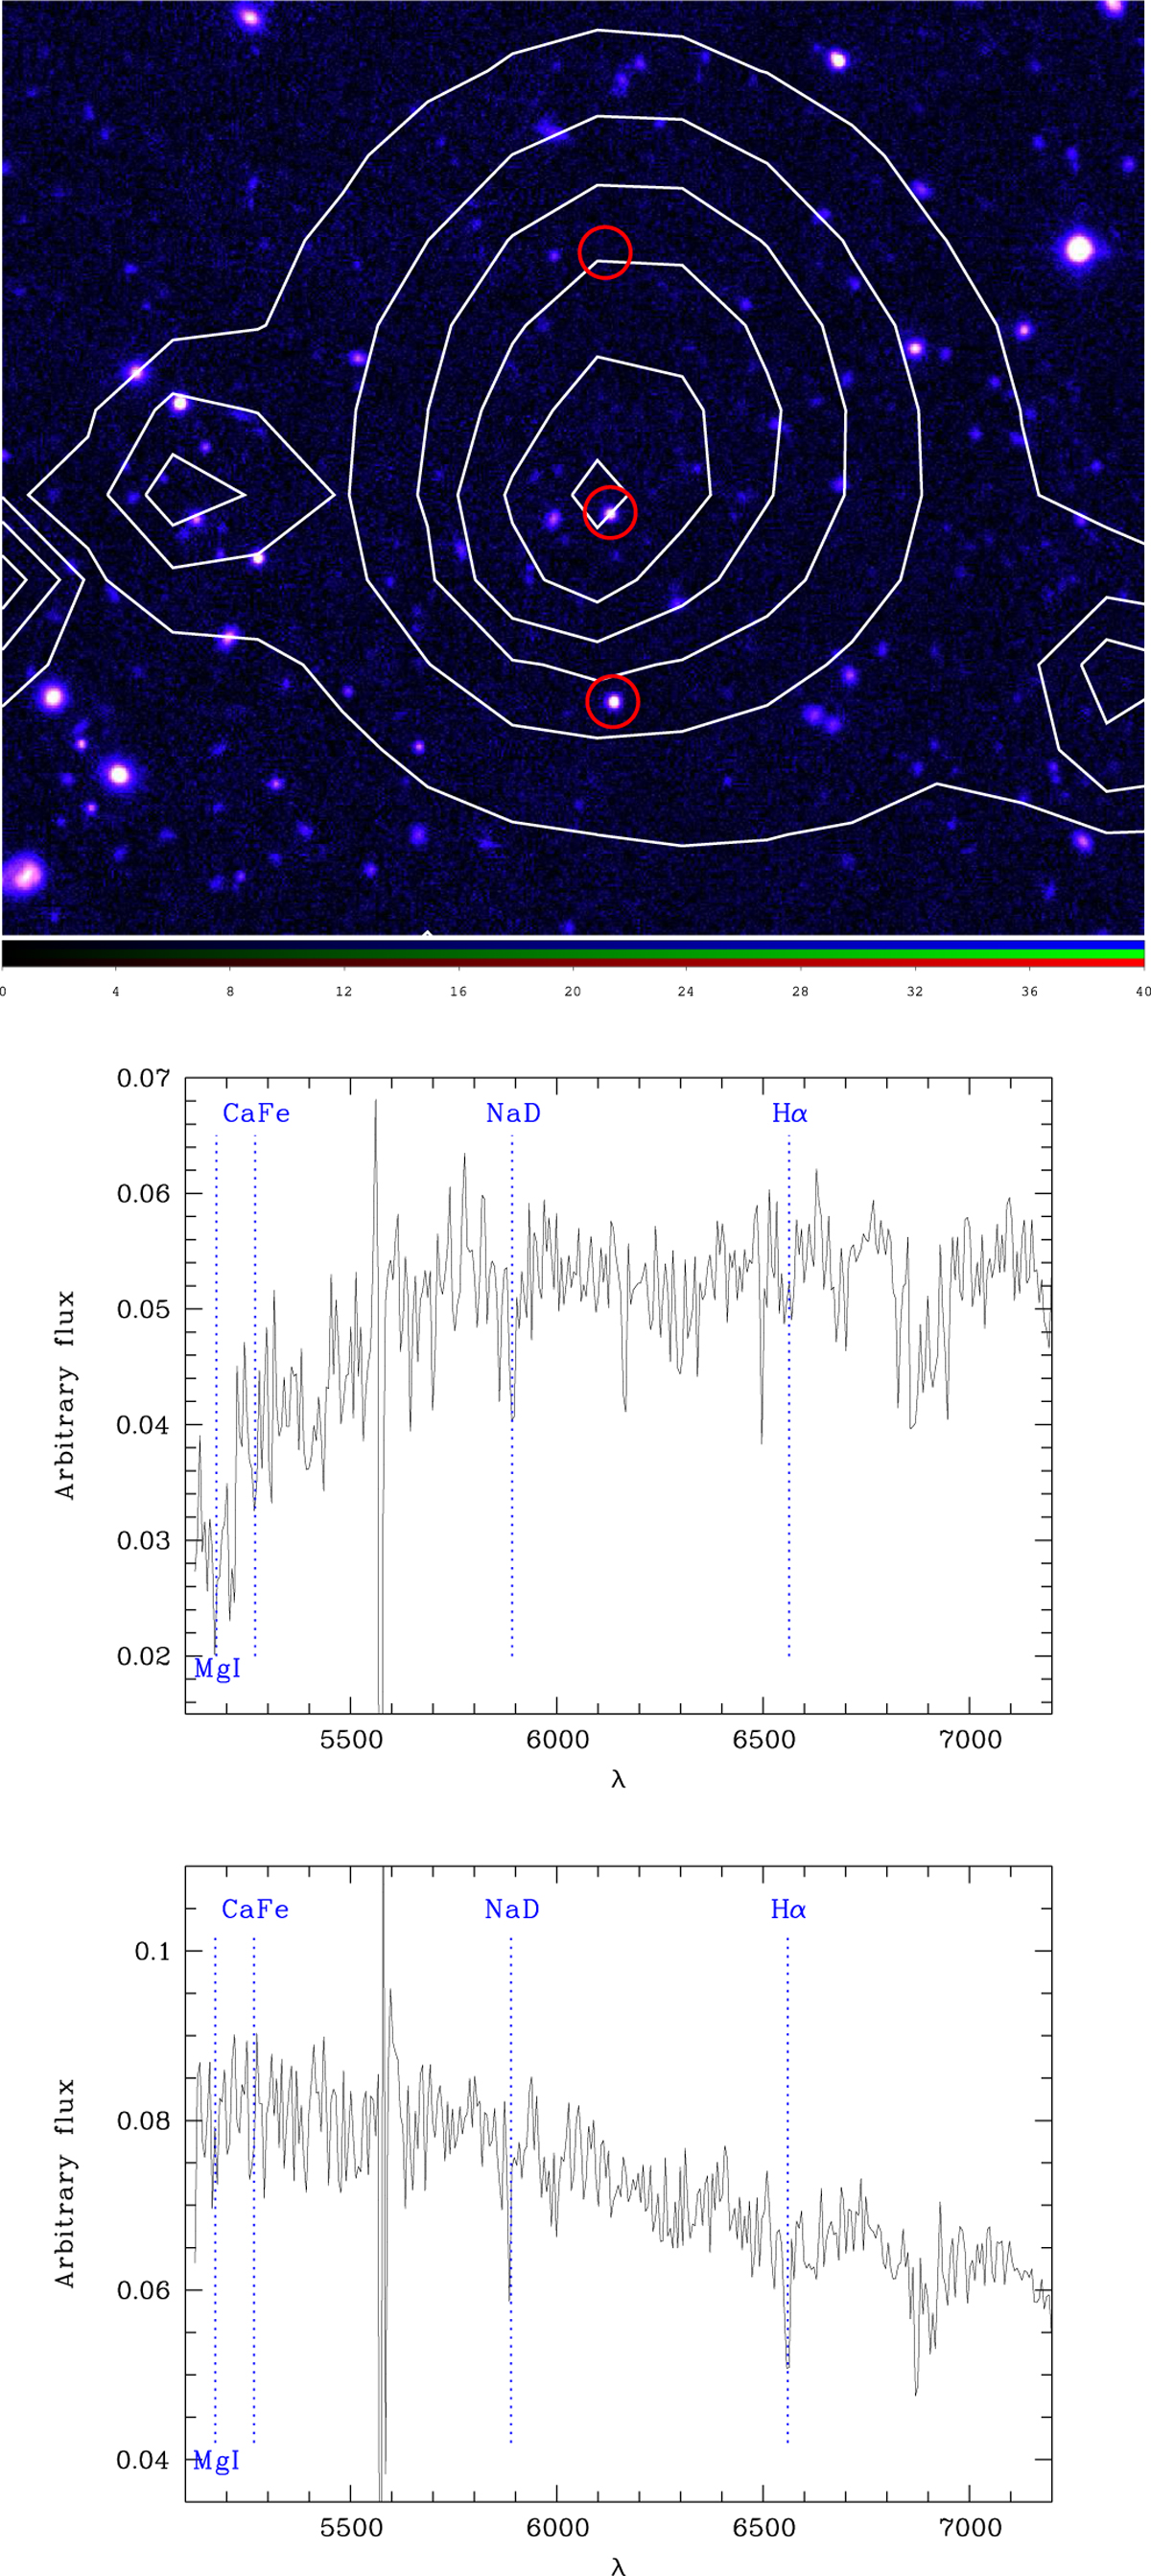
Upper panel: CFHTLS i′ band ~2′× 2′ image of the XLSSC 122 structure. Red circles represent the three detected objects along the line of sight. White contours are for the X-ray emission. Middle panel: spectrum of the southern star. Bottom panel: spectrum of the star close to the X-ray centre.
Current usage metrics show cumulative count of Article Views (full-text article views including HTML views, PDF and ePub downloads, according to the available data) and Abstracts Views on Vision4Press platform.
Data correspond to usage on the plateform after 2015. The current usage metrics is available 48-96 hours after online publication and is updated daily on week days.
Initial download of the metrics may take a while.