Fig. B.8
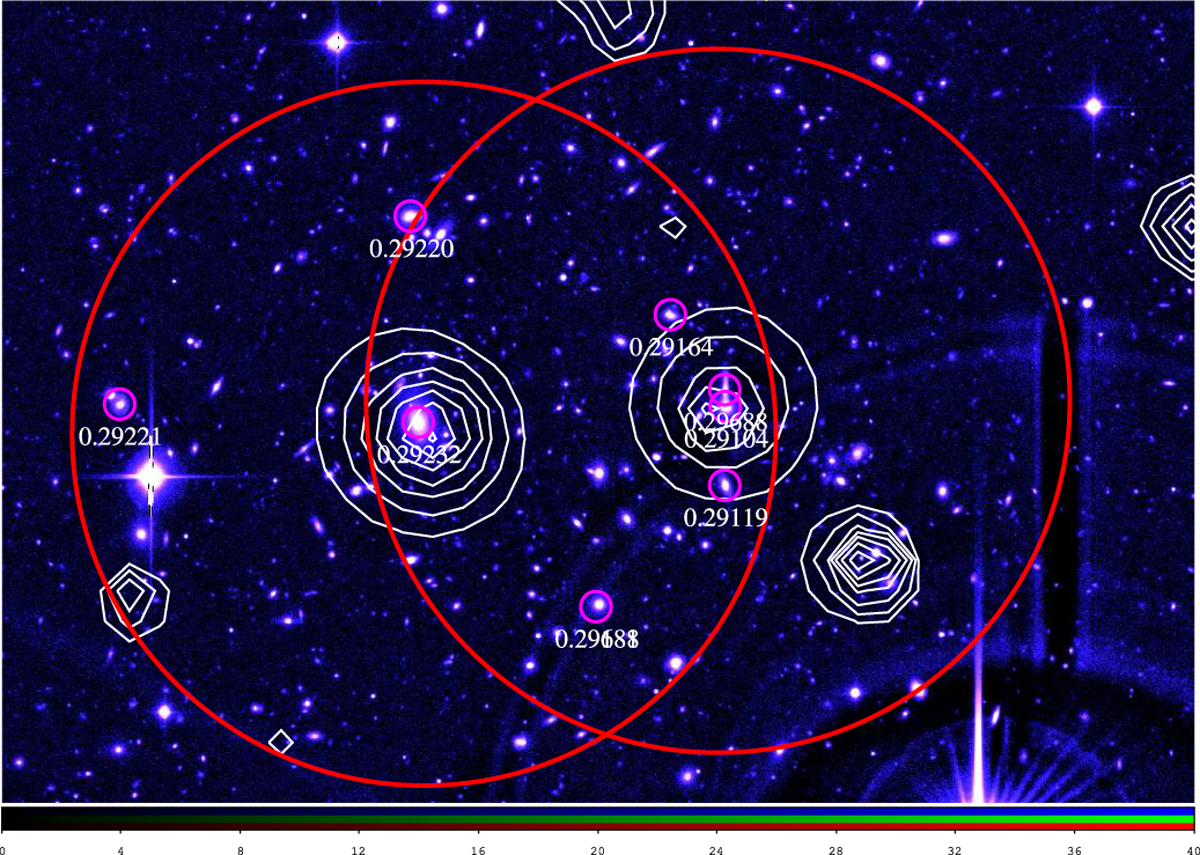
CFHTLS i′ band 6.5′× 4.5′ image of the XLSSC 149 and 150 structures. Magenta circles represent the member galaxies of the two structures at z = 0.292. The large red circles represent 500 kpc radius areas. White contours are for the X-ray emission.
Current usage metrics show cumulative count of Article Views (full-text article views including HTML views, PDF and ePub downloads, according to the available data) and Abstracts Views on Vision4Press platform.
Data correspond to usage on the plateform after 2015. The current usage metrics is available 48-96 hours after online publication and is updated daily on week days.
Initial download of the metrics may take a while.